


%202.png)
Teachers are always short on time. Even with an abundance of data, they don’t have the time to interpret it, much less make informed decisions about intervention, curriculum improvement, or assessment strategy. Single Test Analysis (STA) was built in Aware, our assessment and data analysis tool, to make it easier and faster for teachers to gather actionable data to improve student growth. Through easy-to-interpret graphs, STA provides real-time data on a single assessment, breaking it down by questions, standards, and student demographics.
How our tool saves time and improves teacher effectiveness:
- Because data collection and analysis are automated, the probability of error is lower.
- Automation minimizes the time a teacher spends doing repetitive tasks, allowing them to focus on instruction and student support.
- Data visualizations enable quicker insights into student misconceptions, leading to actionable conclusions with less effort.
- Teachers can use different analytical lenses to target students with specific learning needs and misconceptions.
- Teams can lead confidently and make data-informed decisions.
- Your initiatives come with data, so you can track your progress and iterate on your methods.
Gather high-level assessment trends with the performance summary view
The Performance Summary Tab shows where every student falls within a performance level, such as “Did Not Meet,” “Meets,” or “Masters.” The description for each performance level is set at the district level, so students who meet a certain score threshold will be grouped into these pre-determined descriptors.
Teachers won’t have to do any calculations to determine which performance level a student meets. The system automatically calculates and groups students, so teachers can move to the next step: determining how to help each student grow at their current level of knowledge.
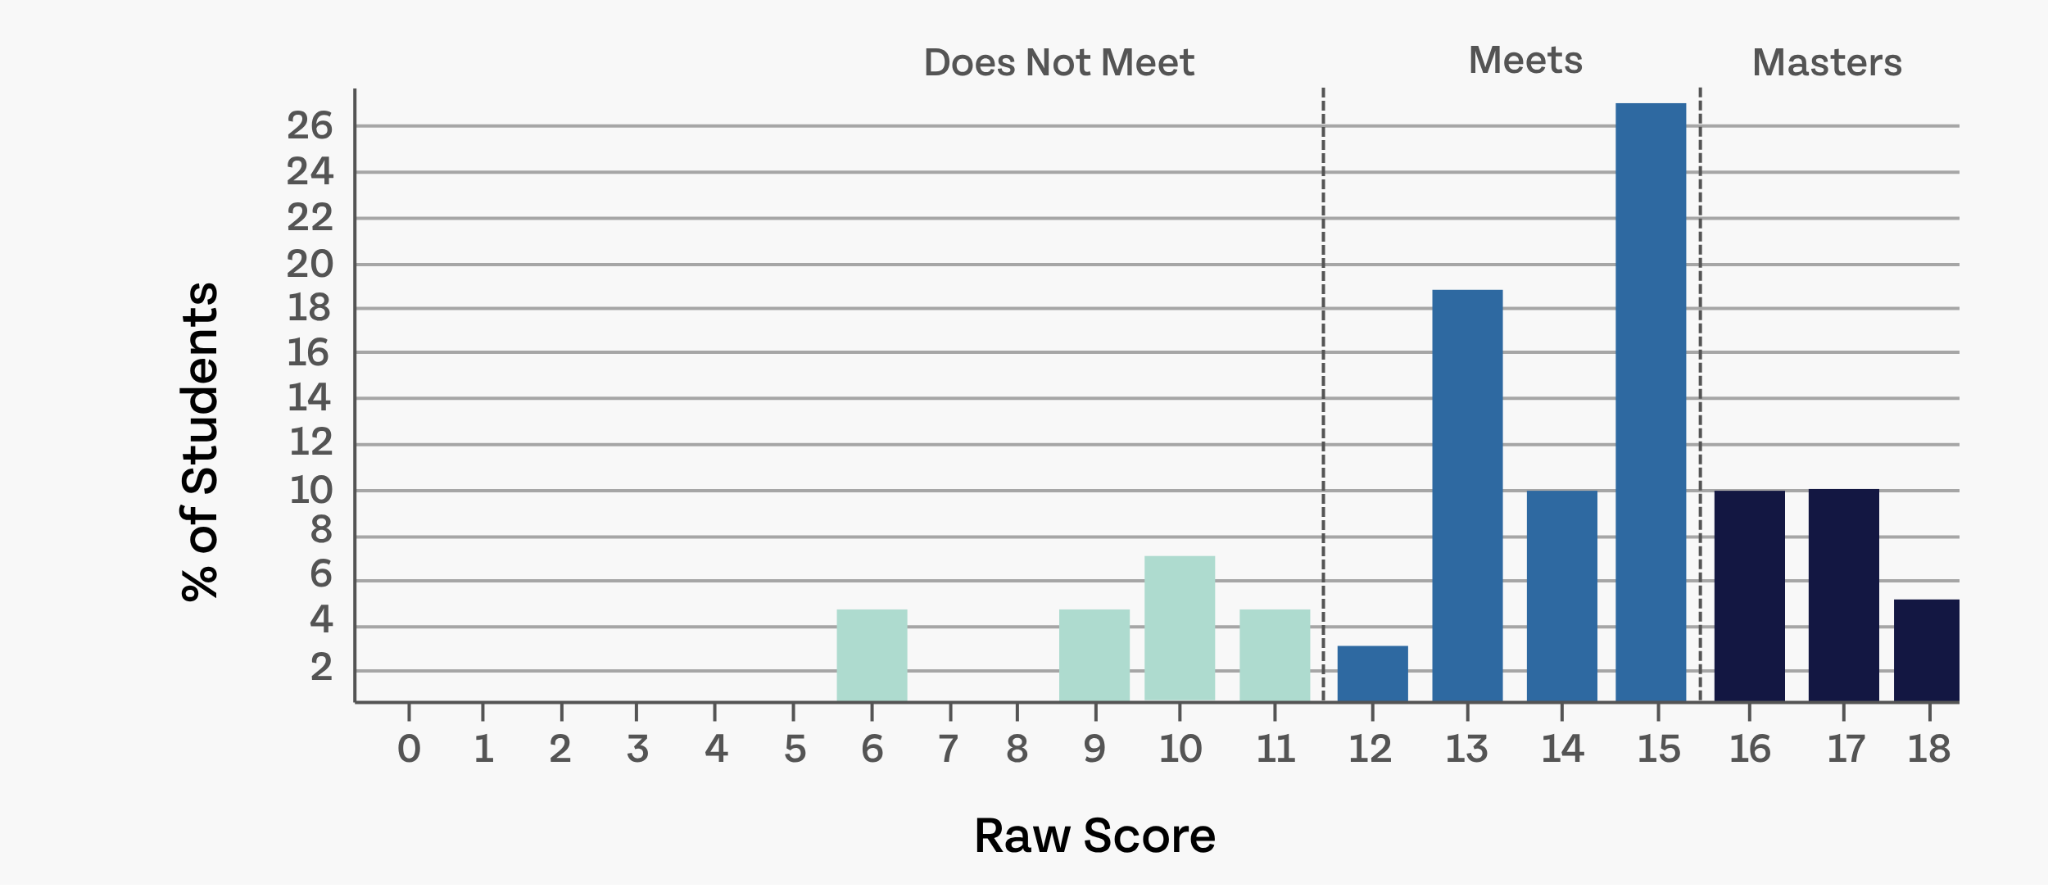
By clicking on the performance level sections, teachers can see which students fall into each category. This makes it fast and easy to group students for intervention or enrichment.
Tool Tips:
- When starting a data analysis routine, it’s best to start with the big picture. Start “big” with the performance summary to get a general idea of where your students are before digging deeper into the specific wins and growth opportunities among your students.
- You can create a “monitor group” directly from this tab. Explore the demographic distribution, or filter by performance level and raw score. Make a list of these students and then create a monitor group. Your monitor group will be easily accessible and updated every time they take a new assessment, so you can check in on their growth. Both teachers and administrators can create monitor groups.
View performance by learning standard for more detailed insights
The Learning Standard Summary tab uses numbered dots to show the depth of knowledge for a question on the assessment and the learning standards it assesses. This allows teachers to see whether they’re assessing the standards and how thoroughly they’re gathering data on them, i.e., how many questions fall under each standard.
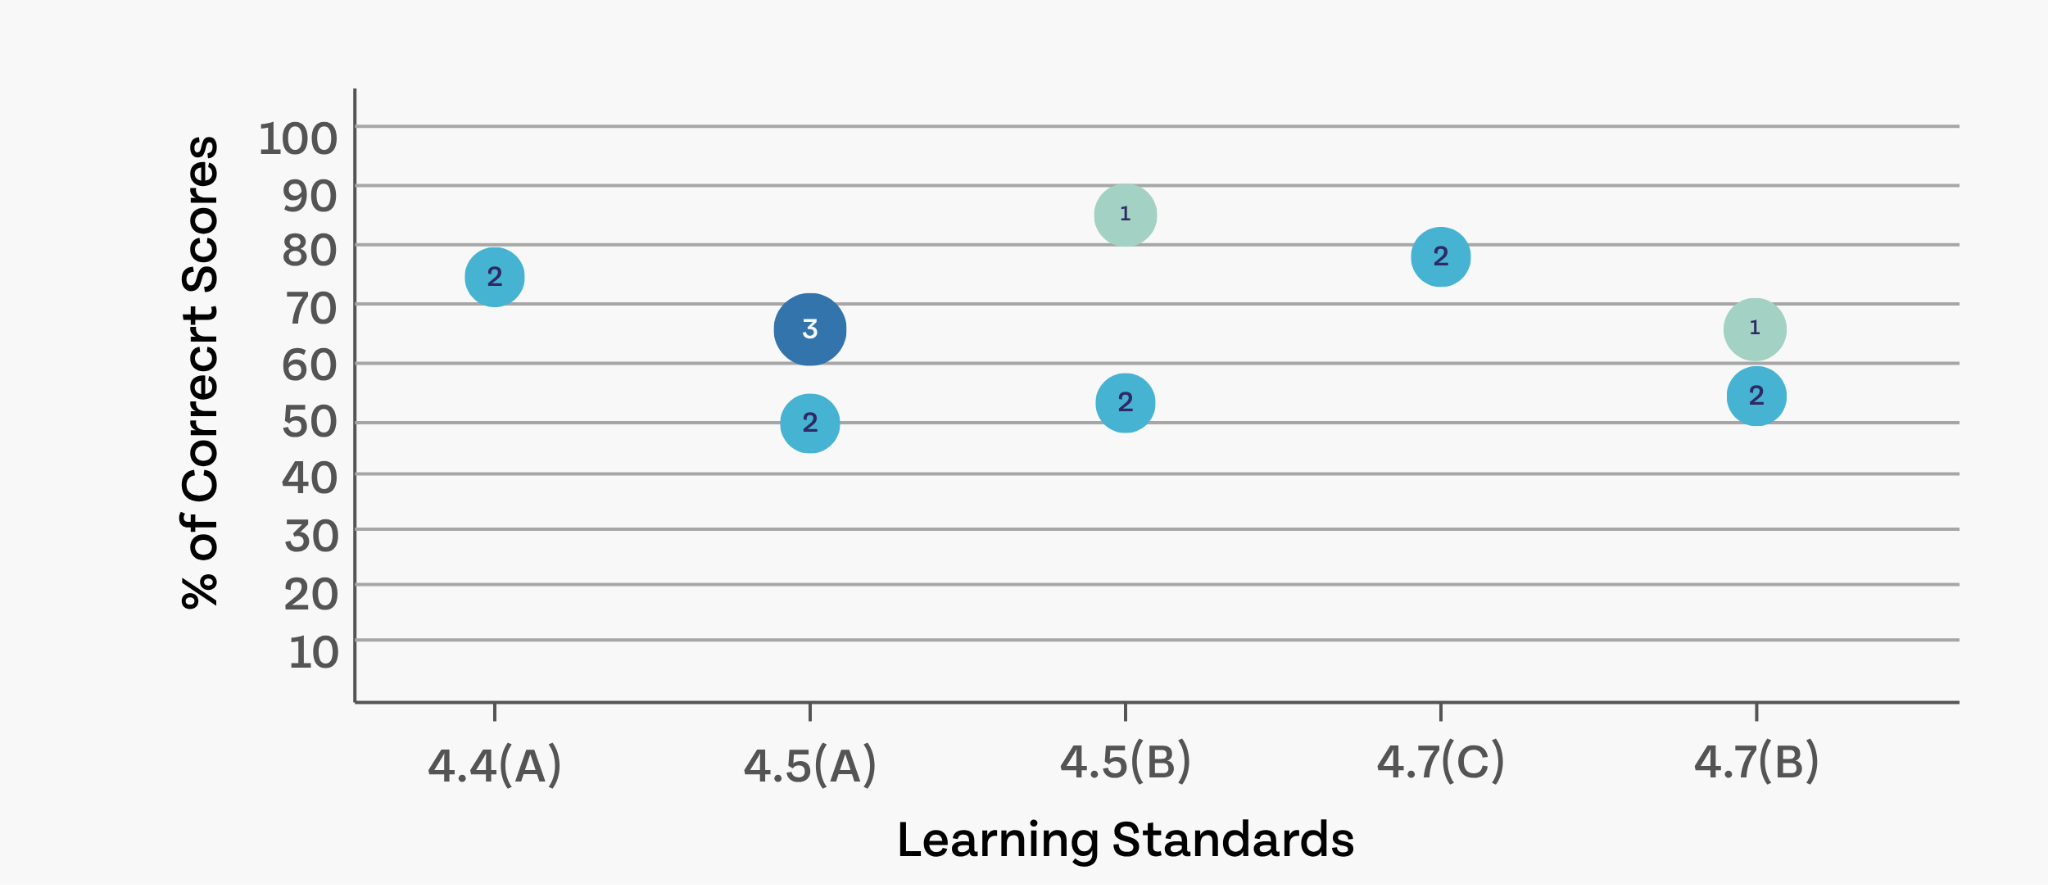
If a teacher is assessing at a DOK that is too high for the students’ current level of knowledge, they’ll be able to see this easily in the boxes at the bottom of the tab. This is also helpful in identifying whether the question’s DOK matches the DOK of the standard.
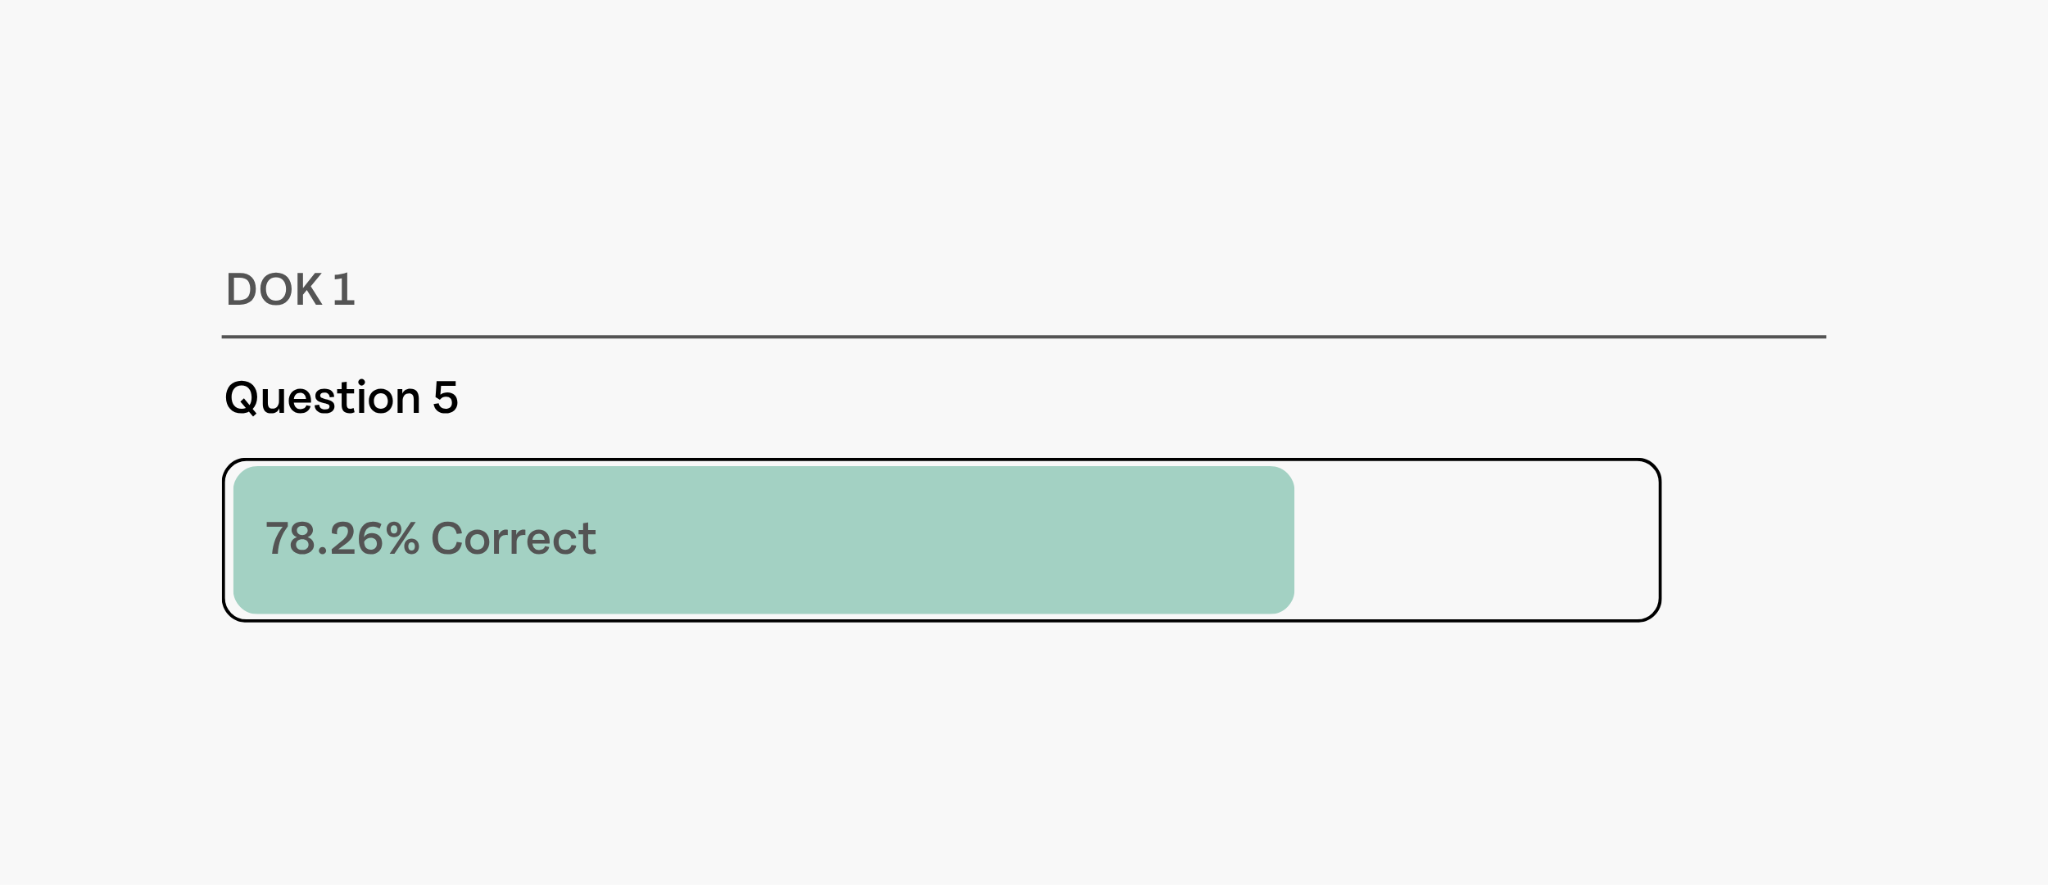
If most students missed that higher-depth-of-knowledge question, it may be time to slow down and build that foundation before moving on to more difficult questions.
Tool Tips:
- This tab can help you identify quality issues with your assessment. If you notice that students are performing better on a question with a higher depth of knowledge than an “easier” question, there may be a problem with either question that needs to be tweaked.
- It’s good practice to include several different questions on each standard you assess, so you can get an accurate picture of their learning gaps. If there’s only one question per standard, you may not get useful data to support that student.
- If you assess student confidence on an assessment, this data will also show in the learning standard tab.
Zoom in on data with Item Response Analysis
The Item Response Analysis tab shows the standards each question is assessing and the percentage of correct answers for each question. Each bar will be colored according to the scoring type. For example, correct/incorrect scoring will be one color, and partial credit scoring will be another.
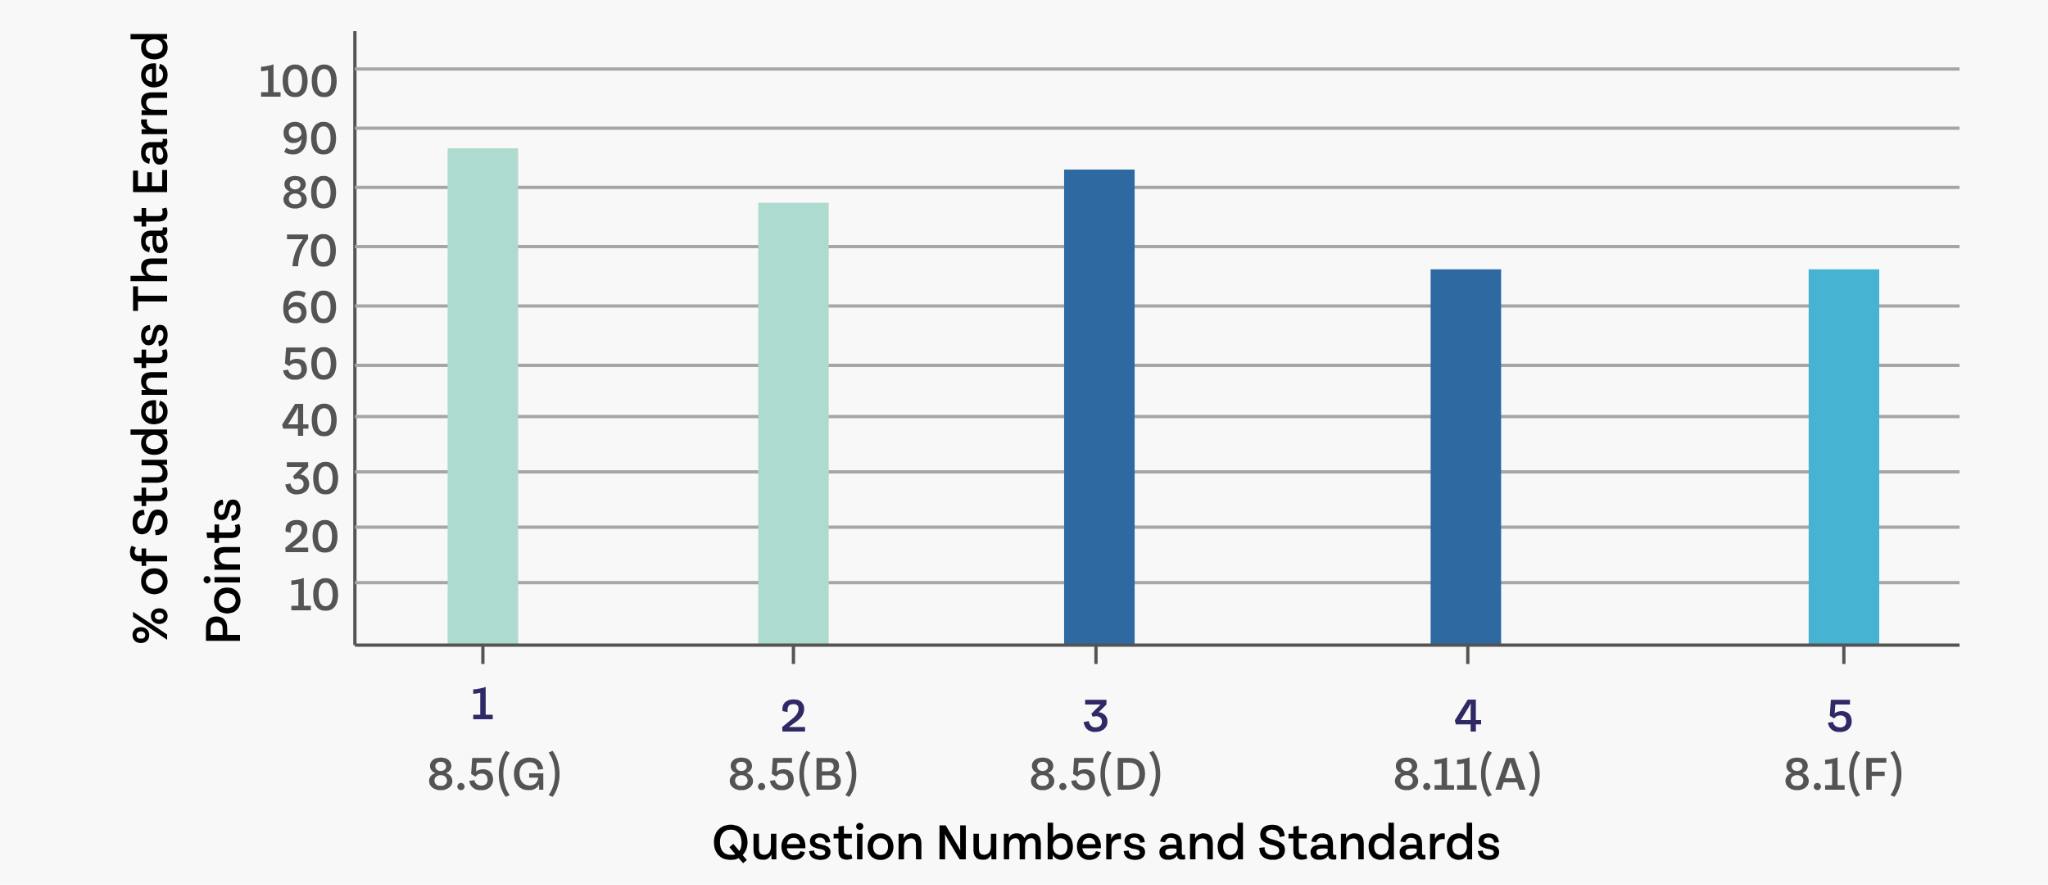
This makes it fast and easy to identify standards that need to be revisited with the entire group (meaning the percentage bar is low for everyone) or with a small group (most everyone got this question correct, but a small group did not).
Tool tips:
- You can click on a test item to see the question. It will show the question, the answer distribution, and the student’s individual responses.
- By looking at the question and answer distribution, you can quickly identify students who fell for “distractor” answer choices and/or create groups to address misconceptions through intervention or re-teach.
- If you want to see how a specific student answered a question (say, because this student has been receiving interventions on this standard), you can search for that student to see their answer. Don’t forget to click on the student’s name in the table to see exactly what the student selected on the question. It will show you a preview of the question with the student’s selections/interactions.
Our districts love Single Test Analysis
“"We have Aware Premium and are LOVING it! I just trained all teachers of STAAR tested subjects on Item Test Analysis, the Student Confidence Rating Tool, Retest and Reflection tool!"
- Lumberton ISD
“Our district vision for data usage is for teachers and students to seamlessly move from data to action in the classroom and we have seen remarkable improvements since we started using Aware, particularly with the implementation and usage of Single Test Analysis, Multi-Test Views, and Mastery Tracker…Single Test Analysis has been particularly fun to watch, because it saved teachers so much time, that as a district we literally just showed people the button and within days this is the primary way that teachers accessed short cycle assessment data, which is a pretty major feat in a district of over 8,000 employees and over 24,000 students.”
- Chris Julian, Carrollton-Farmers Branch ISD
“Through the usage of AWARE Premium data views and the Leadership Report card, the Humble ISD Teaching and Learning department has been able to support campuses in their beginning of year content standards data analysis.”
- Sherita Williams, Humble ISD
Connect with us to see how Single Test Analysis can help your teachers support students
When you talk with our team, you’re talking with experienced educators who want to help you identify problems in your specific district, so we can talk about solutions. For a personalized demonstration, click the demo button below.
Not ready to commit? Learn more about STA with these resources
Aware Premium: Data Visuals for All Item Types and More (Webinar)
Data Analysis: Engage Your Campus PLCs (Webinar)
Now that You Have Data, What’s Next? (Webinar)
Unlock the Power of Assessments in Aware (Article)




%20(1).png)
%20(1).png)
.png)