We're heading into a critical time of year—test prep season! Teachers often crave more data to guide their instruction, and Aware is a powerful tool that provides heaps of data on student progress, demographics, and performance. However, it’s easy to get lost in advanced analytics and overlook the simplest, most powerful ways to gather the insights you need.
That’s why we’re revisiting the most straightforward methods for accessing and using your assessment data in Aware.
If you’re a current customer, stick around to get a refresher on the easiest ways to access student data in Aware. If you’re new to Eduphoria products, you’ll want to keep reading to see just how easy it is to assemble data, analyze it, and make confident decisions for student improvement.
Quick Views replaces spreadsheets for versatile data views
Because there are multiple ways to access data in Aware, you may not have even heard of some of the methods we’re about to discuss, so before we get into how to access data tables, let’s talk about what Quick Views is.
Quick Views provides live, updated assessment data for students on a teacher’s roster. Administrators can also access quick views, depending on their rights within the application. Quick Views is easier, faster, and more versatile than a spreadsheet because users can adjust their dropdowns to get as granular and specific as they’d like when accessing data.
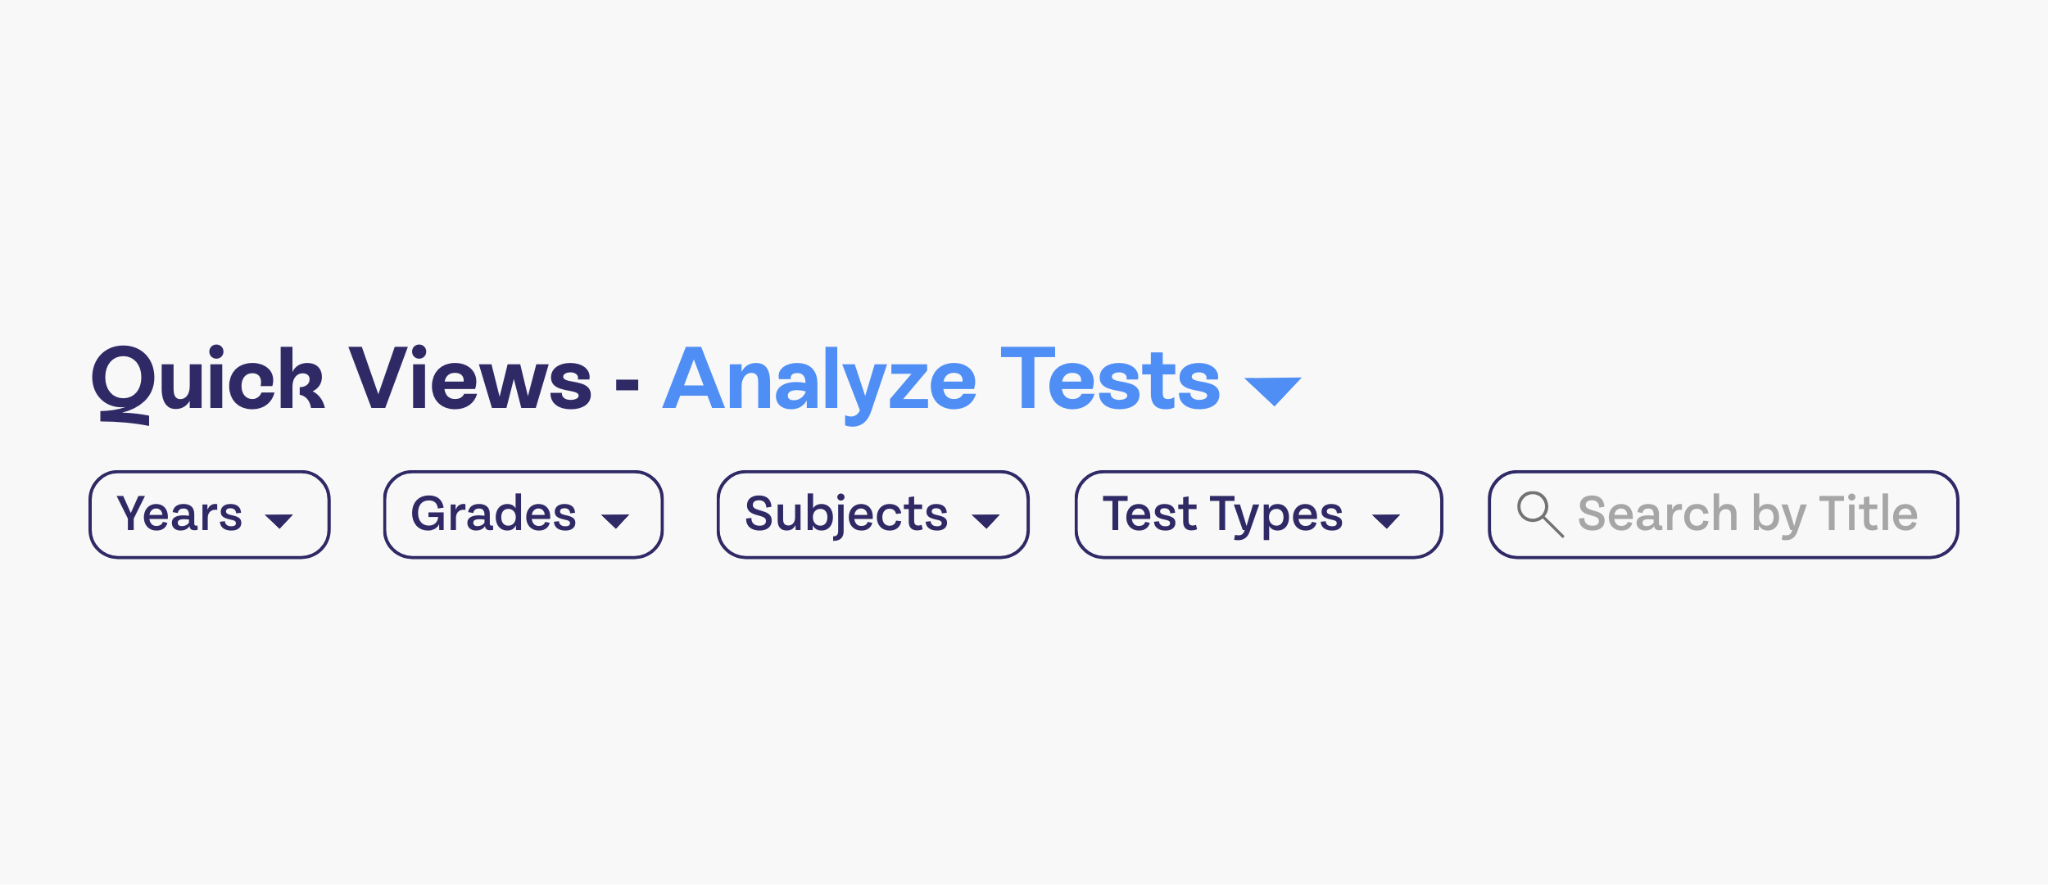
Quick Views is incredibly versatile for comparing data over time. Say you want to track student progress between major assessments.
- You can create a Quick View for each class period by selecting your drop-down filters and choosing the tests you want to include.
- For long-term progress (e.g., comparing current performance to end-of-semester results from 2025), simply add the historical test to your filter and save it using the bookmark icon.
- This view is then saved in your Data Views Banks! As new major assessments happen, you can edit that view to include the latest data, making it a powerful long-term progress tracker.
So, what exactly is the Data Views Bank? The Data Views Bank is where all of your favorite data from quick views lives. We know you’ll be visiting and revisiting certain views (especially because your data will update as new information comes in). This makes it easy to access them without having to adjust your filters every time you want to see that data.
Single-Test Analysis (STA) is your best method of making quick, effective data-based decisions
Single-Test Analysis (STA) was built for one primary purpose: to make it fast and easy to draw conclusions about assessment data, test by test. It's the go-to place when you're deciding who needs intervention, enrichment, and support.
STA provides instant, live data visualizations that you can filter in several meaningful ways. Since we’re aiming for simplicity, let’s focus on the key questions each view can answer:
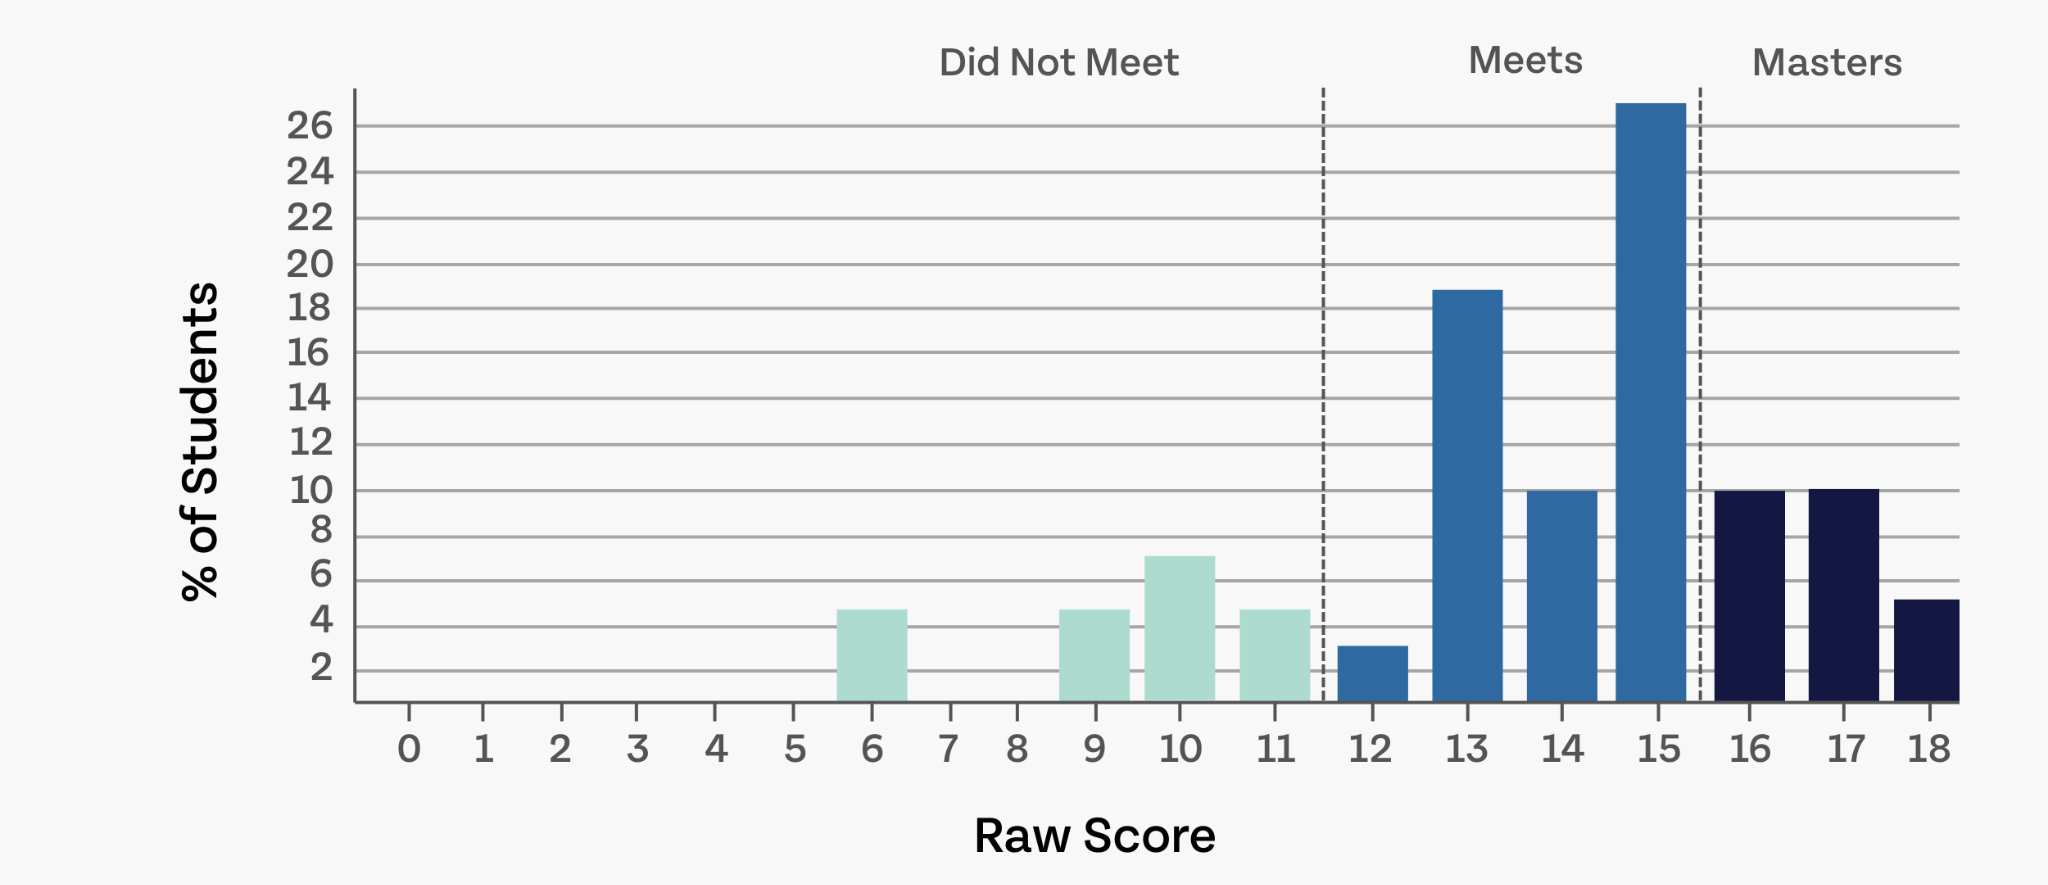
1. How are my students performing overall?
The Performance Summary tab answers this most basic question. It quickly splits your students into performance levels, offering an immediate spot check on the overall performance distribution in your classroom.
2. How do different demographic groups compare?
You can filter your performance summary by demographics using a simple drop-down. This lens is essential to ensuring that all your students receive the care and attention they need.
Why might you want to compare demographics? People who deal with accountability will know right away why this level of filtering is useful, but filtering by demographics is helpful for reasons beyond “crossing your t’s and dotting your i’s” for the state. You’ll have a variety of students in your classroom with diverse needs. When you filter by demographics, you can see if your teaching methods are reaching all students in your classroom equally, or if you’ll need to adjust your methods, create learning groups, or craft specific interventions for students who need additional (or different kinds of) attention.
Filtering by demographics also makes it easier to check up on students who you already know need a little more help, such as those with disabilities. It can be a fast and easy way to get a visual on how they’re performing, where they stand compared to their peers, and how well they’re progressing with each assessment.
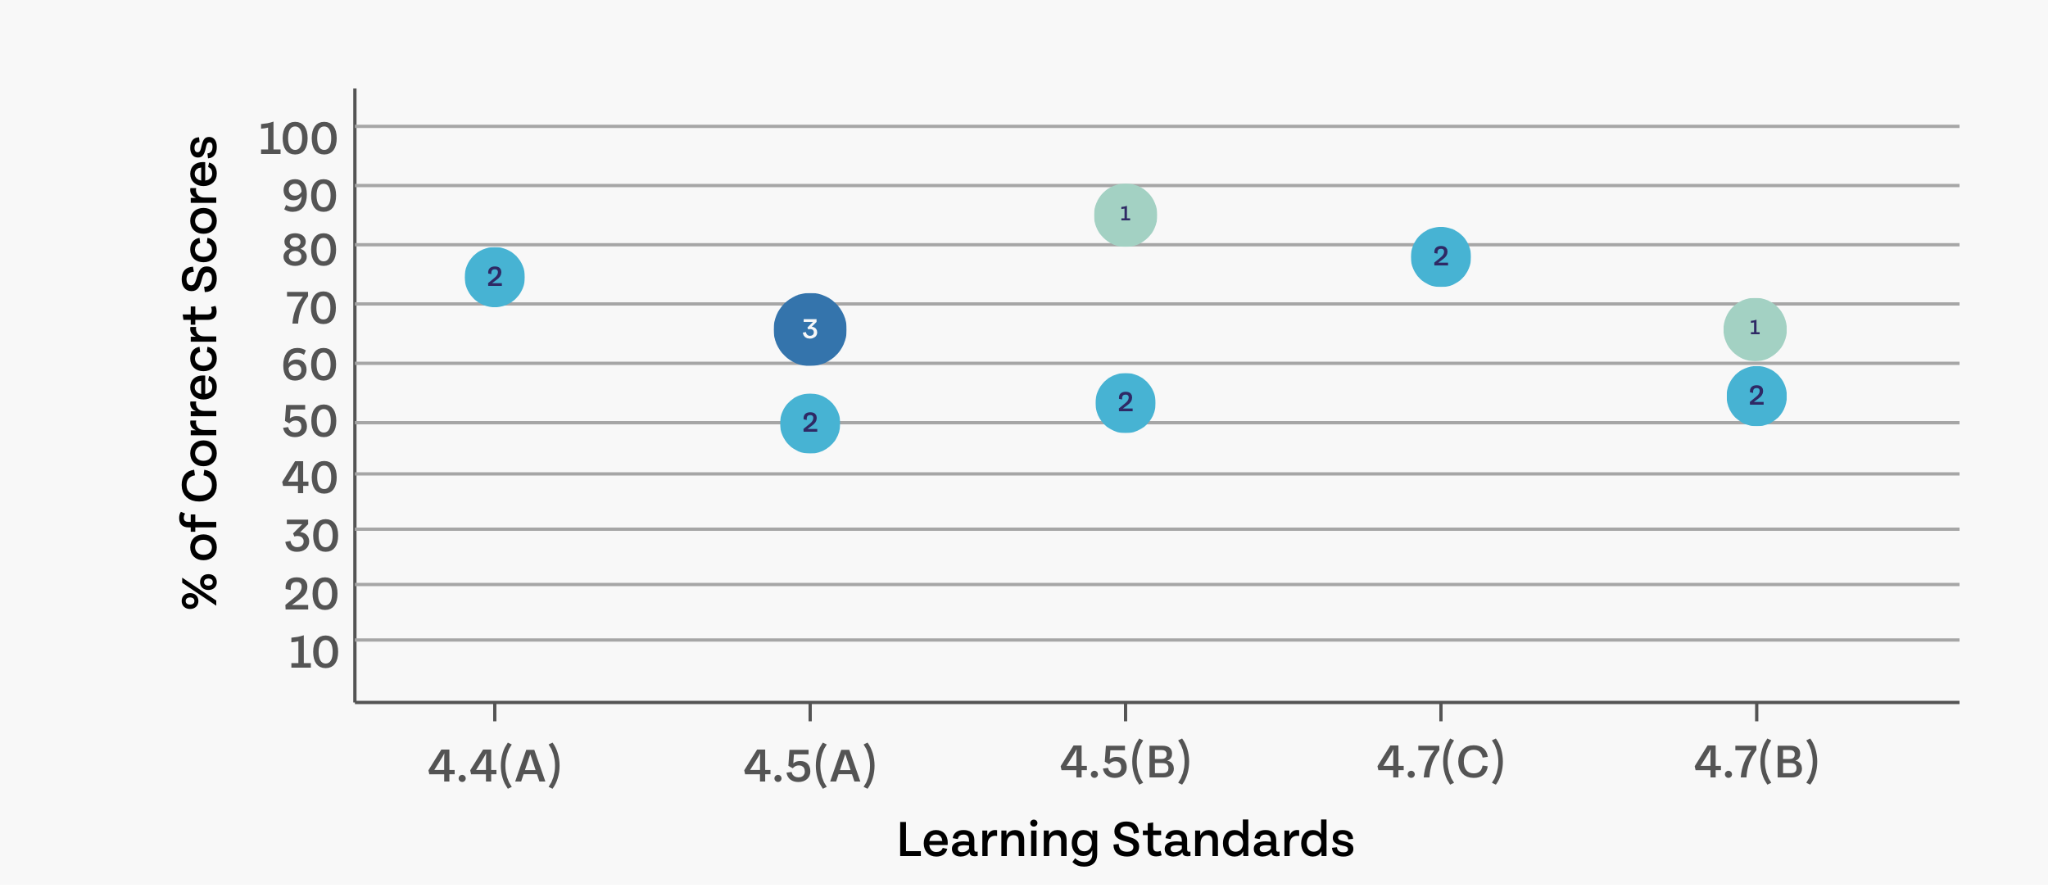
3. Are there any primary standards that students are not understanding?
The Learning Standard Summary tab filters results by the standards you assessed.
- It helps quickly identify learning gaps by referencing the learning standard (x-axis) and seeing which Depth-of-Knowledge (DOK) levels were assessed on that standard.
- Click on a standard's circle to see the percentage of students who answered the question correctly.
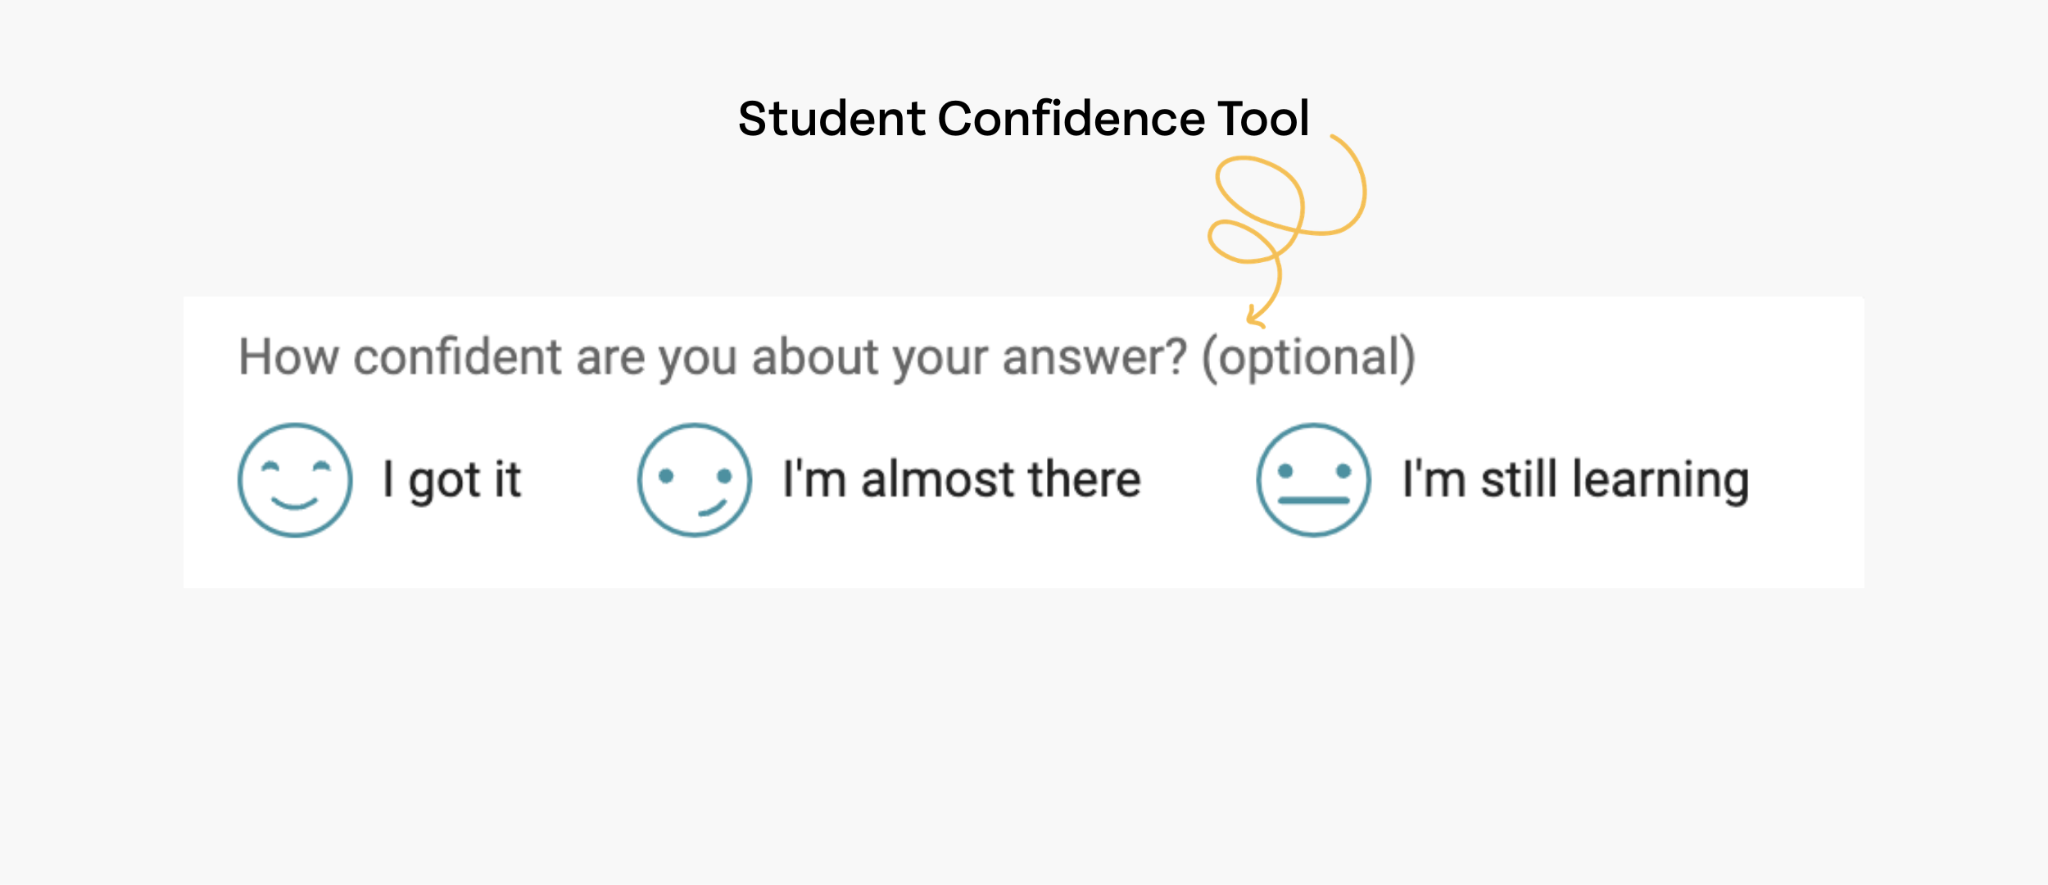
4. Are my students guessing or answering confidently?
The student confidence tool gives students an opportunity to rate their confidence per assessment question. It’s optional, so data may be spotty depending on how well students use the tool, but it can provide extremely useful, nuanced insights into student performance.
If student confidence is enabled, the Learning Standard Summary tab also displays your student’s confidence levels at the bottom of the graph. You can click on a standard to see DOKs compared in the context of the students’ confidence ratings.
So, let’s say you’re looking at student performance on a standard that is essential for vertical alignment. You assessed at a level 1 DOK, students performed well on this question, and the student confidence rating was overwhelmingly high! That’s something to celebrate, and it tells you that students felt really good about this question and this level of knowledge.
Now, let’s say you had a question that assessed at a level 2 DOK. Student performance is quite low across the board, but their confidence levels remain high. This ought to signal a major classroom-wide misconception that needs to be addressed. If students were that confident about their answer, there may have been a miscommunication during the lesson, OR the question is flawed and needs to be changed.
5. Which questions on the assessment do I need to revisit?
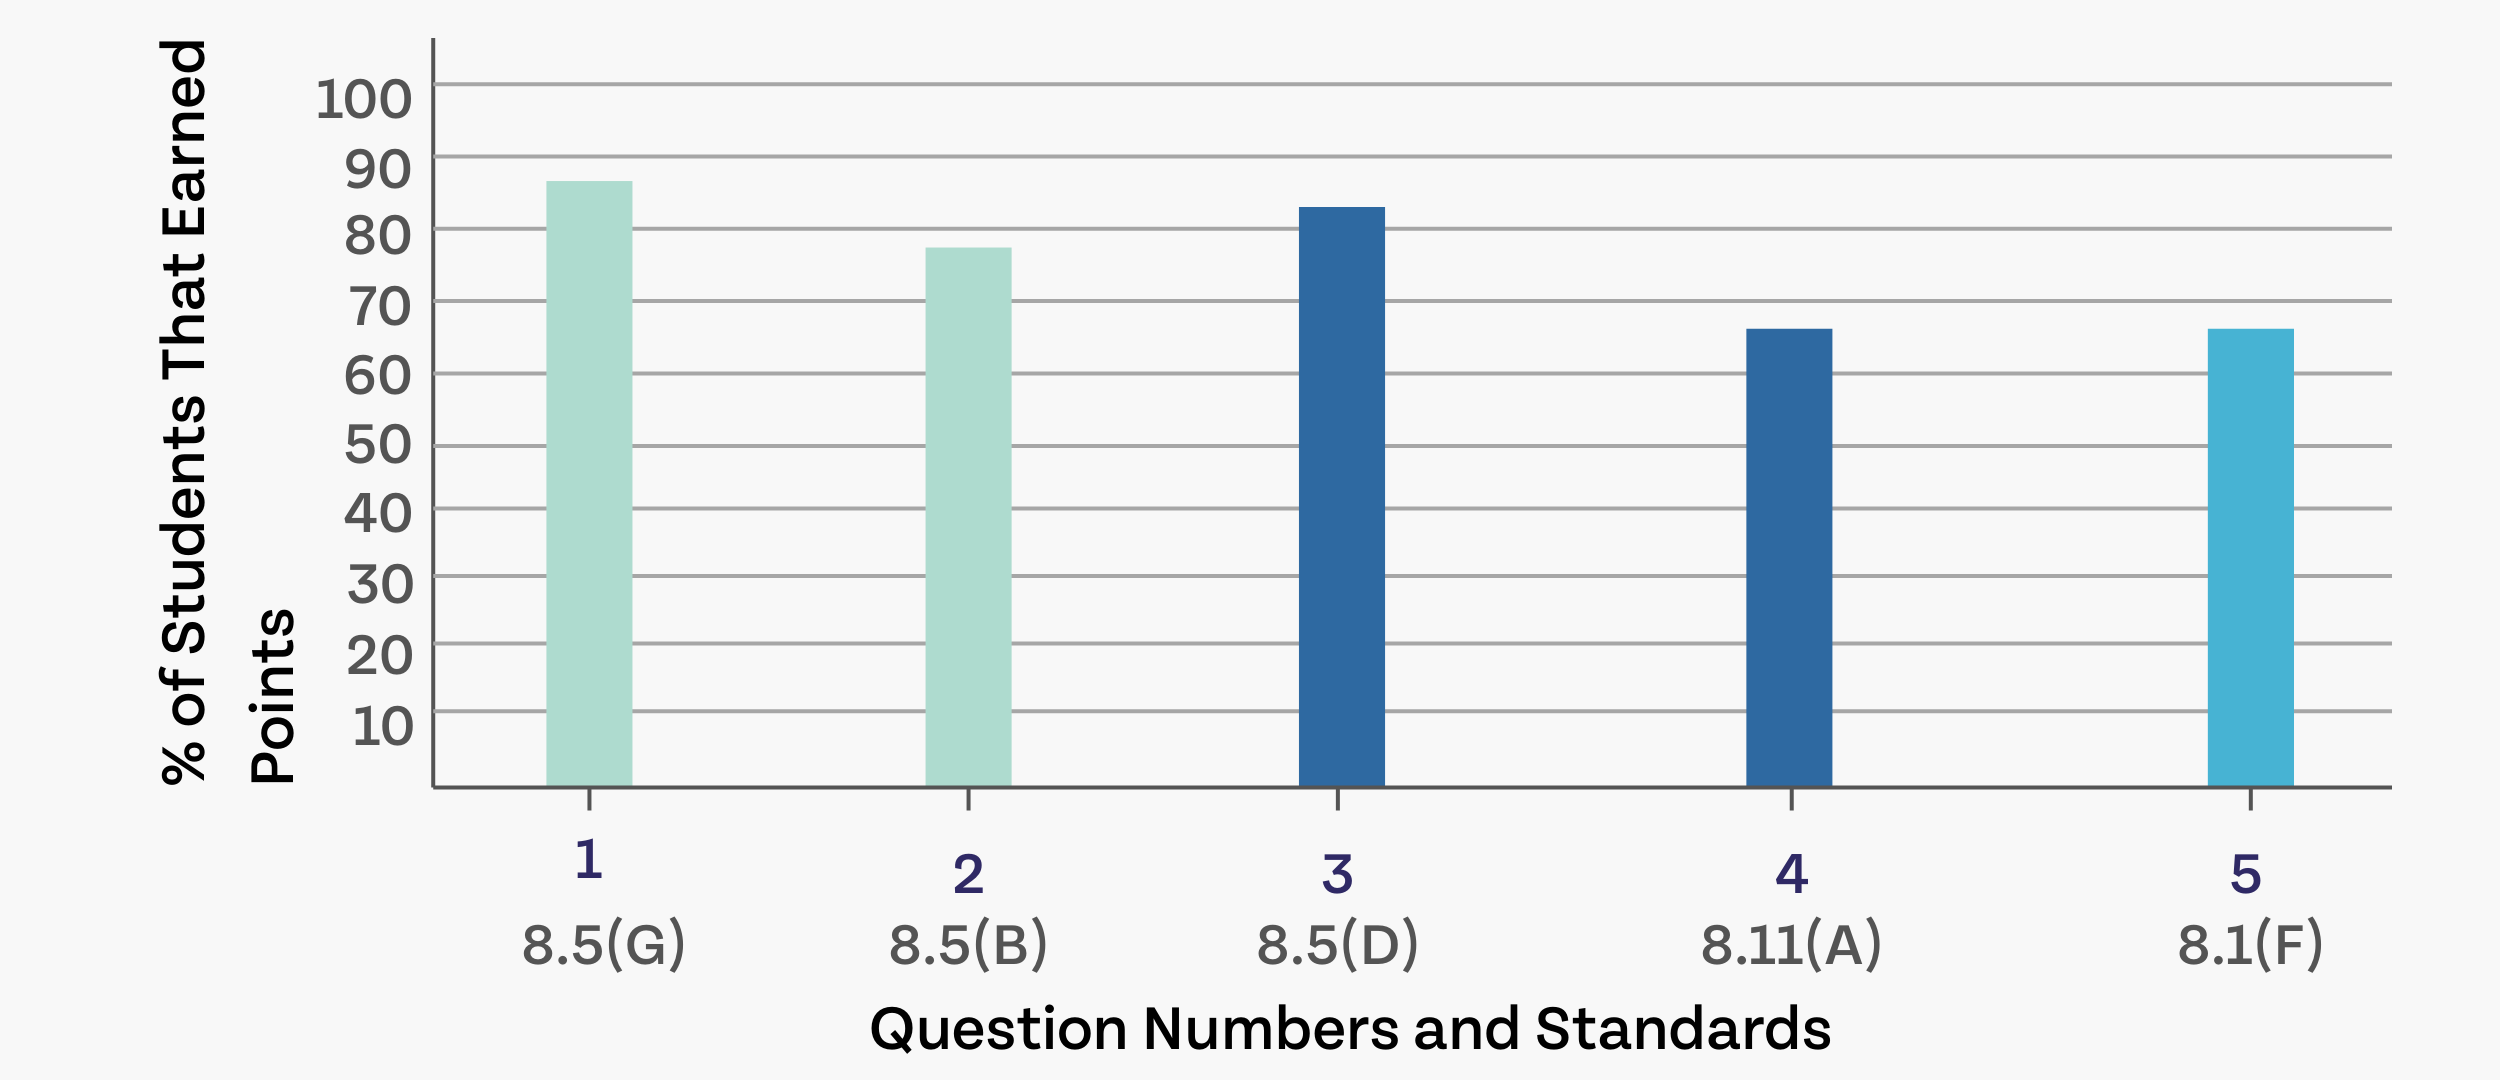
Performing an item-based analysis is useful for two main reasons:
- You need to see which specific questions, standards, or skills need to be revisited through an additional lesson or intervention.
- The question itself may be flawed and needs correction.
In the chart, question numbers and the standards they assess are on the x-axis. A bar will show how well students performed. If one question shows significantly lower performance than the others, it signals that it needs further analysis. Either your students have a fundamental gap, or the question is flawed.
Once I have the data, what’s next?
The entire goal of having data this accessible is to take time off your “data analysis” plate and add it to your “student interaction” plate. Still, if you’re new to data analysis, it may feel like the next steps aren’t so obvious.
We have several resources on data analysis for beginners, but for the sake of this article, we’ll keep it as clear and simple as possible.
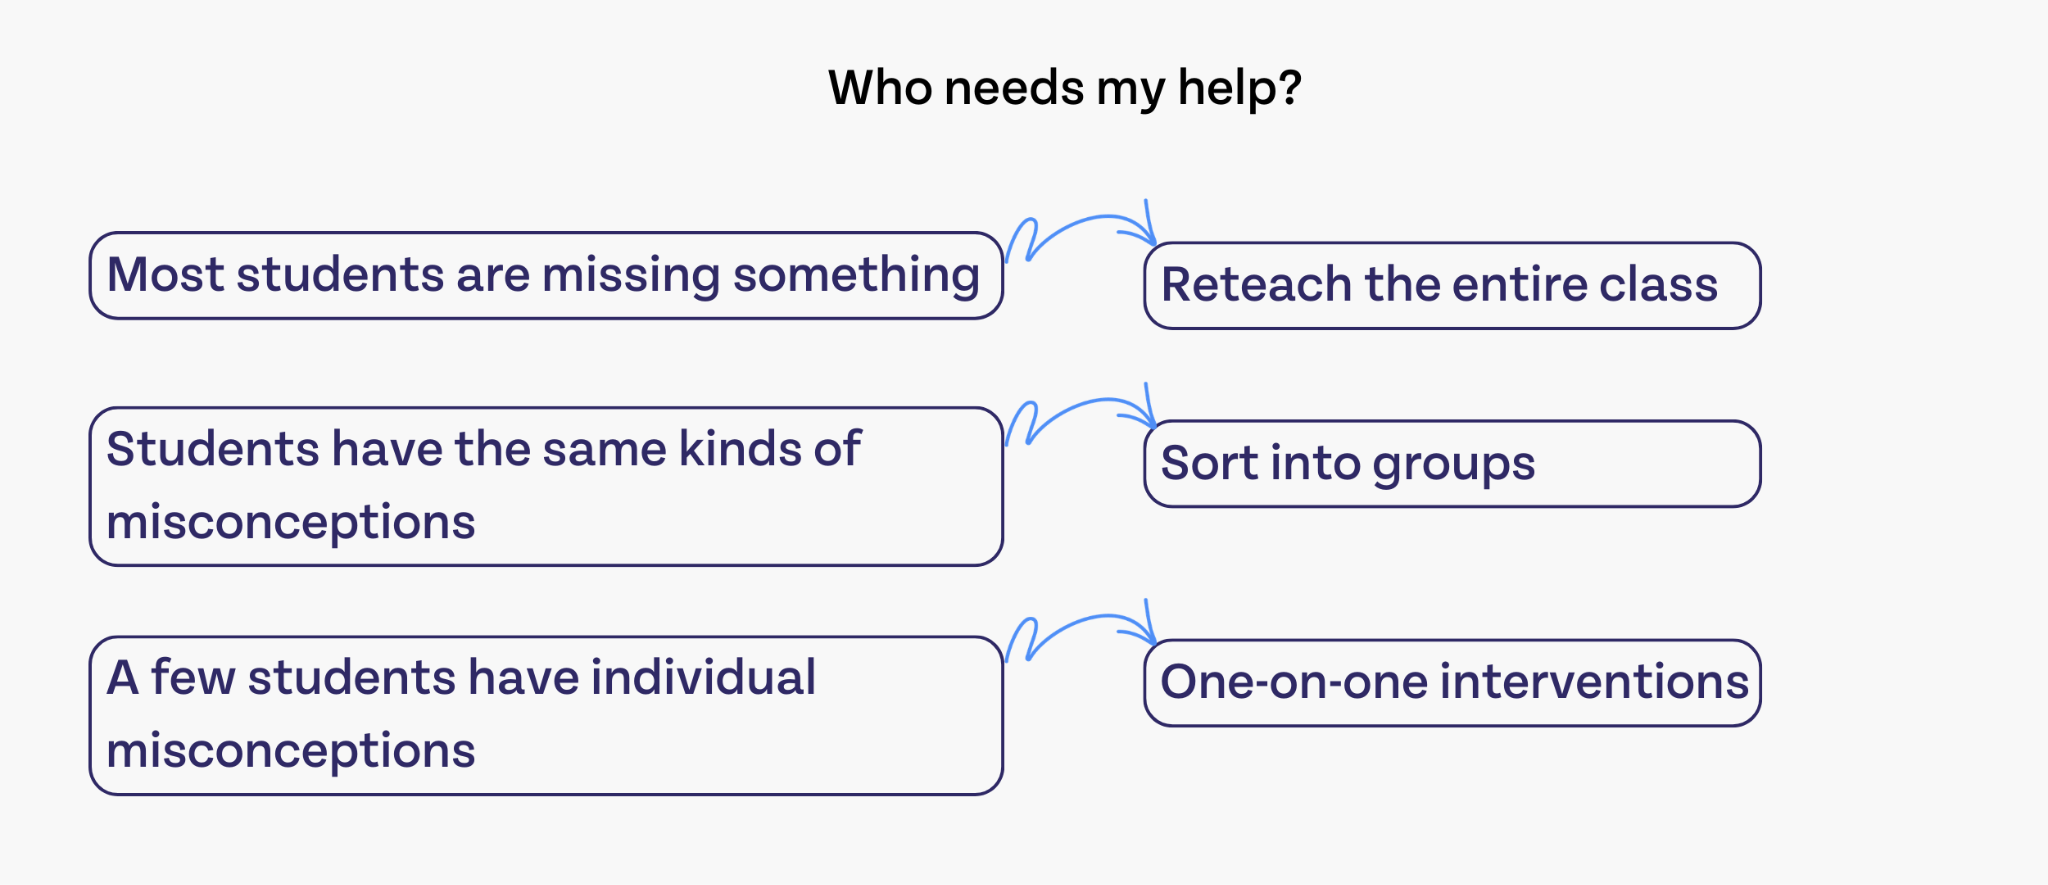
Step one: Who needs my help to close learning gaps?
The percentage of students in your classroom who need help AND the kinds of misconceptions among students can help you take the next step to form interventions. Here are some suggestions for how you could take those steps.
Step two: Who needs my help to stay engaged with continued learning?
The students who are performing well and ready to move on need some help to stay engaged! Here are some steps you can take depending on who is ready to move on in your classroom.
.png)
Step three: Follow up on student progress with retests and formative assessments
Whether your students are filling knowledge gaps or preparing for the next unit, you need to continually monitor their progress to make the best educational decisions.
When you try new interventions, lessons, or strategies with students to reteach important learning standards, best practice is to reassess that student to see how effective your strategies were and what else they need to progress. Be sure to keep your testing environment and assessments as consistent as possible to ensure their retest scores are accurate.
With formative assessments, you can use a variety of methods to check student understanding, including:
- Bell ringers and exit tickets
- Assignments
- Quizzes
- Verbal check-ins
- Games or activities
- Thumbs up/down check-ins
- Forms
This is all important data! Don’t let your bell ringers, exit tickets, and other casual assessments go to waste. Use that information to make decisions about the student.
Are you subscribed to our newsletter?
Whether you’re a current customer or new to Eduphoria solutions, subscribe to our newsletter! You can opt in to our once-a-month updates newsletter or our spotlights newsletter, a more in-depth, use-case specific review of what you can do with Eduphoria software. We can’t wait to see you there!


.png)
.png)