


%20(1).png)
How do you know that the data you’re using for program improvement is trustworthy? Is data even accessible enough for administrators to use it for program improvement? If your district or school is running on gut instinct to make decisions, Multi-Test Analysis (MTA) will change the way you lead. We built MTA as part of our assessment and data analysis program, Aware. Among all of the districts we’ve worked with over the years, there’s a common thread: data is hard to find, even harder to interpret, and it’s difficult to do anything with the data you collect. Thanks to our easy-to-interpret data visualizations, customizable progress profiles, and correlation view, these problems are a thing of the past.
How this tool improves student outcomes and streamlines analysis processes:
- You don’t have to guard your assessment spreadsheet with your life anymore. Your assessment data is safe in our data management system, and only those with the appropriate rights can create progress profiles and generate comparisons.
- You no longer have to manually convert different types of assessment scores (such as raw and percentile scores) to make accurate comparisons.
- Time that administrators used to spend on data entry, manual exports, and macro formulation can now be spent on using the data they collect to improve their programs.
- Pinpoint exactly where the instructional frameworks or adopted curricula are falling short so you can make curriculum decisions with confidence.
- Identify specific demographic groups and individual students who need support using years of their assessment data to ground your interventions.
- See which teachers, teams, or departments may need classroom support or professional learning to achieve your specific student growth goals.
Create custom progress profiles to see actionable data at every level
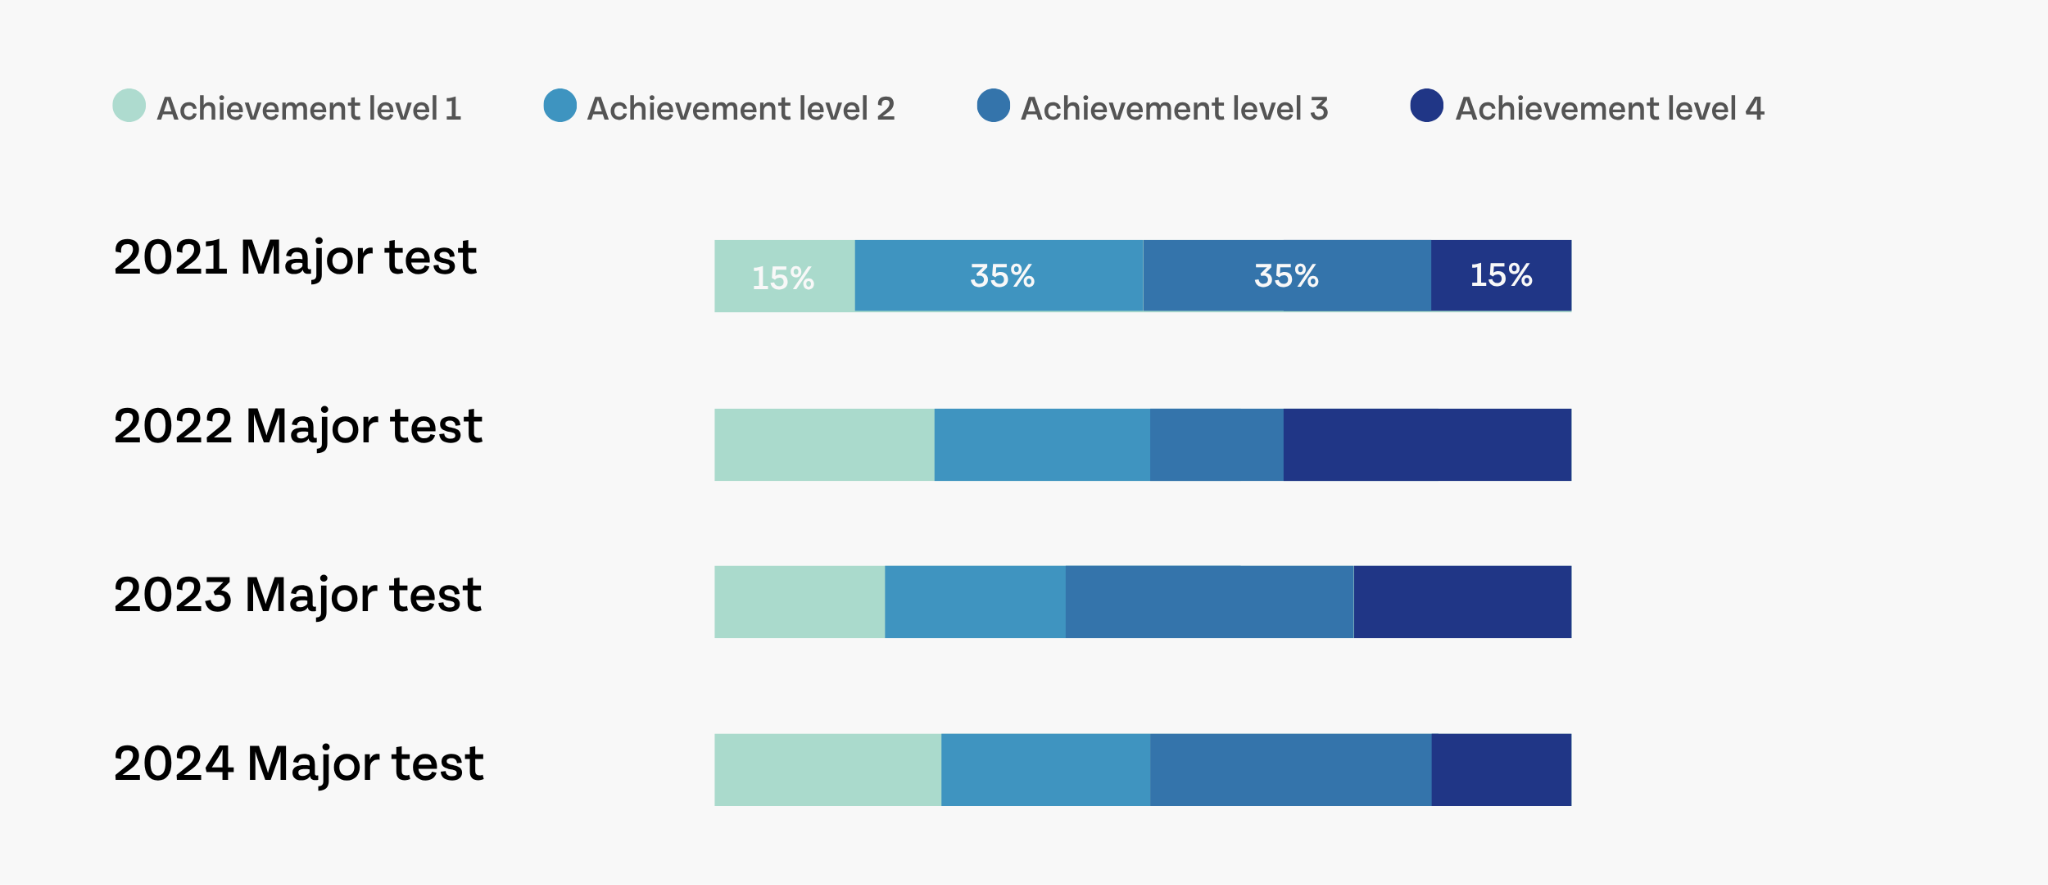
Leaders can create custom achievement levels and progress profiles to measure growth in the way that’s most relevant to their community. Customizable achievement levels mean that general or state-level achievement cut-offs (such as a variety of scale scores being defined by a “meets expectations” performance level) don’t have to define your local goals for student achievement.
Tool tips:
- The progress profiles aggregate and define this data for each stakeholder, defining progress in the ways that are most relevant to each level of accountability for student growth.
- Using the bar charts and progress matrices, observe trends over multiple years to identify systemic issues impacting student achievement.
- Create comparisons across assessments with different data types using achievement levels. Align raw scores, scale scores, and percent scores on local tests, so performance levels match.
- Analyze the teacher and cohort summaries to identify trends that could indicate a drift in performance. With this data, administrators can see whether students are receiving the same quality of instruction across schools.
- See which students need additional support with individual student progress profiles. These profiles track chronological shifts for individual learners over time, making it easier to identify trends and to make targeted student growth decisions.
Compare local assessment check points to summative measures to improve assessment validity
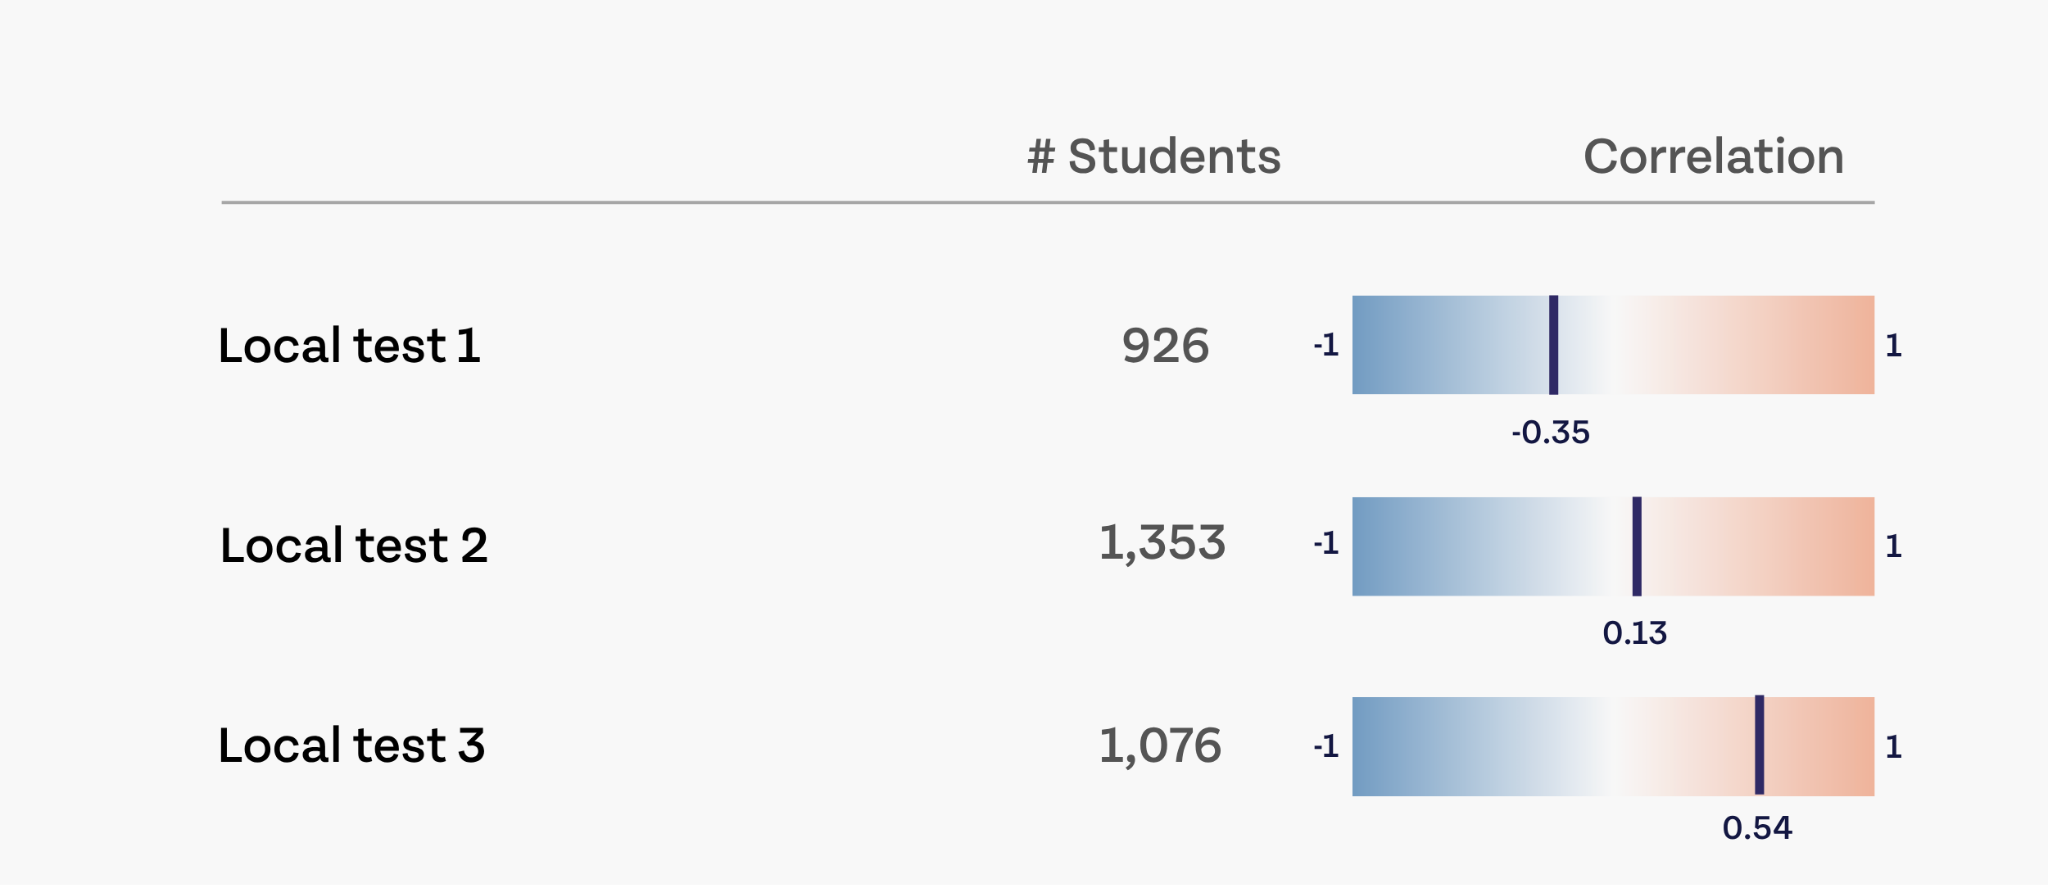
In the correlation view, leaders can see how well their local assessments stack up to summative measures (such as state benchmark tests). Assessments with strong alignment to summative tests help leaders to confirm that local assessments are predictive of student achievement on higher-stakes assessments. If the rigor of local assessments does not align with summative measures, you can easily identify these discrepancies using correlation visualizations.
Tool tips:
- Start with the high-level view showing a quick correlation value at the district level.
- Next, use the achievement level comparison to determine the test’s validity compared to the assessment you’re modeling after.
- The achievement level comparison shows how much a student’s achievement level changed between assessments. A student who lost two achievement levels would show as -2.
- Toggle between the graph and table view to get into the numbers behind the correlation.
What our districts are saying about MTA
“We have received a variety of training, from those of us new to Eduphoria learning the ropes with program audits to campus and district teams learning single and multi-test Aware…Because of this training we now have academic specialists building test views to support their teachers in helping their students academic growth!”
- Cindy Tucker, EMS ISD
“We are excited to see a full implementation of Multi-test Analysis and already are receiving rave reviews for this feature’s ability to streamline our data analysis processes and to save us the dreaded task of transferring data from one sheet to another. Eduphoria's Aware tools have been invaluable in helping us achieve our educational goals. The improvements in student engagement, teacher effectiveness, and PLC culture have been evident across the board.”
- Chris Julian, Carrolton-Farmers Branch ISD
Want to learn more about MTA before you book a demo?
The 7 Steps of Assessment Program Analysis (Article)
Evaluating Your Assessment Program Using Multi-Test Analysis (Webinar)
Enhance Instruction Program Evaluation with Specialized Data Tools (Webinar)
Book your live demonstration to see how Aware and Multi-Test Analysis can boost student growth efforts
When you talk with our team, you aren’t just talking with a salesperson. You’re talking with people who have spent decades in education as teachers and administrators. We know what schools need, not just because we’ve worked in schools, but because we’ve built our tools in collaboration with the districts we serve. Book a demo to see what educator-built software can do for student achievement.




%20(1).png)
%202.png)
.png)