.webp)
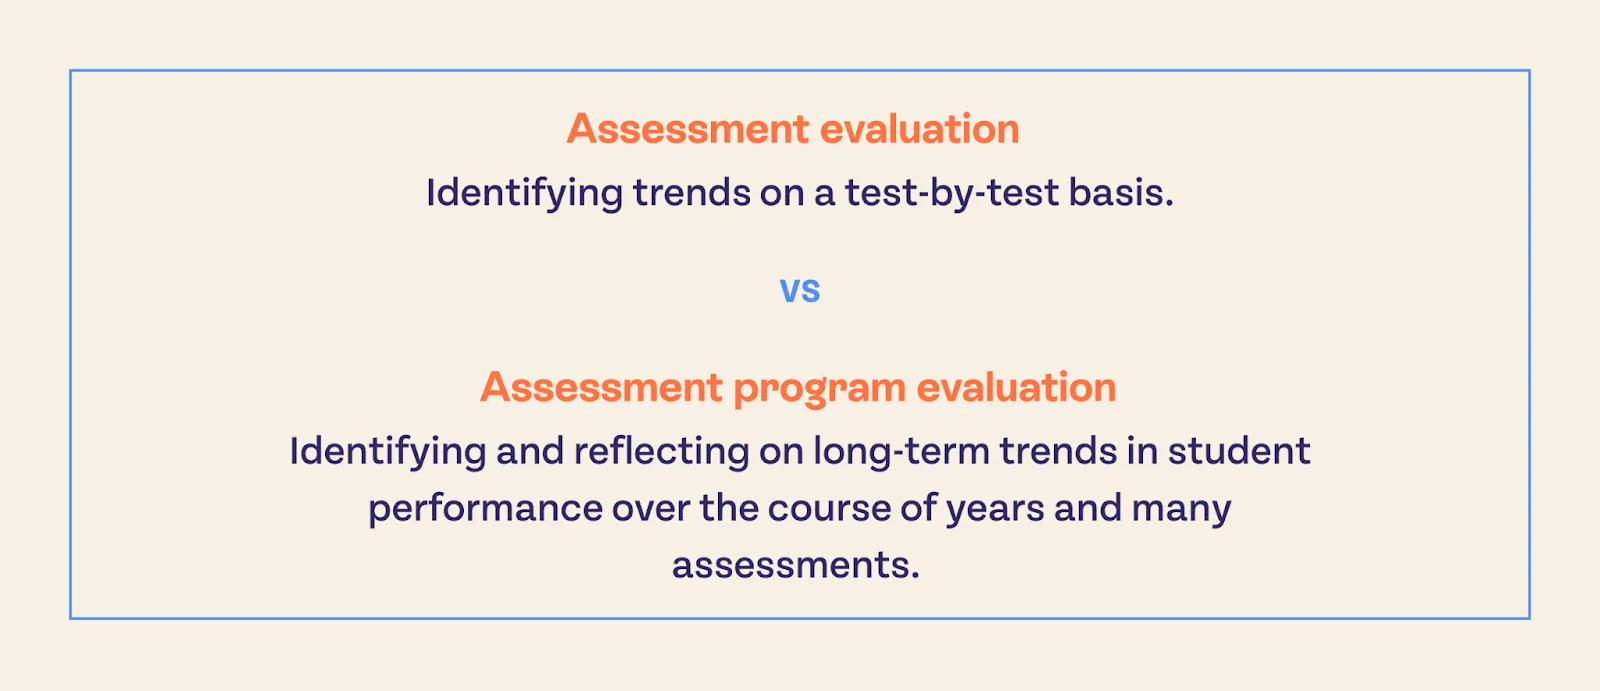
Evaluating an assessment program is an in-depth process. It involves many data points, digging into trends and what they mean, and a willingness to answer tough questions. Too often, assessment programs are evaluated at a surface level or not at all. For example, in assessment evaluation, trends are identified on a test-by-test basis, lacking reflection on long-term trends and their implications for student performance. Assessment program evaluation does just that, analyzing student performance over the course of years and many assessments.
Let’s work through a framework that can be used to conduct an evaluation of an entire assessment program at the district and school level. I’m going to include practical steps that can be conducted with spreadsheet software alone, but these steps are infinitely easier to do in Aware’s Premium* analysis tools.
Before diving into the framework and steps required to evaluate your assessment program, let’s define why it is important.
Assessment program evaluation is the systematic analysis of all assessments administered across an entire district (or school). The types of tests can include local tests, benchmarks, diagnostic tests, and state-level standardized tests. The goal is to determine how well your local assessments align with curriculum standards, promote meaningful student learning, and inform instructional decisions.
Assessment Programs that do not undergo periodic evaluation will suffer from stagnation in student performance, lack of alignment to the standards, gaps in instructional rigor, and performance drift over time. Continually encountering these problems can even lead to inequity problems for instructional alignment, over-testing, resource allocation issues, and gaps in the strategic use of instructional intervention strategies.

- Define the purpose and scope of the work
- Inventory all assessments
- Evaluate standards alignment
- Analyze student mastery
- Compare performance trends
- Make recommendations and build a plan
- Communicate and monitor
Now, this feels like a lot of steps, but many of them are related and would be happening at the same time. Think Venn Diagram with overlapping influences and tasks, so that while working on one thing, you could potentially be working on a couple of others at the same time with the same tasks. Many of these steps can be done by using Eduphoria’s Aware and documenting your findings as you go. So, let’s get started.
Before you can begin a full-fledged assessment program evaluation, you need to identify the goals of the task. I’ve outlined some of those goals in the framework, but you don’t necessarily have to be aiming at all of them to conduct a review. As such, pinpoint your goals.
Are you trying to:
- Determine if assessments are aligned to standards and curriculum?
- Decide if assessments are useful for instruction?
- Determine if local assessments are predictive of more standardized assessments like STAAR or MAP?
There are many different goals that could be identified, and the above ones are just a few. The main idea is to start by identifying what you want to know so you can begin to plan how you’re going to get there.
This sounds like it could be a daunting task, especially if you’re in a large district with many schools. If this is the case, you can refine your inventory by narrowing the field down to match the goal.
For example, if your goal is to determine if your local assessment scores are predictive of scores on summative assessments, you can focus on analyzing those specific assessments and bypass assessments that aren’t aligned with that goal.
In any case, this step entails combing through your assessment practices and identifying all of the different types of assessments your district gives. These can be everything from local common formative assessments like unit tests, to state standardized tests. You can create a table of some kind that identifies the key attributes of the assessments. Some of those attributes could be:
- Assessment name/type (e.g. unit test, benchmark, MAP, STAAR)
- Grade level(s)
- Subject(s)
- Frequency
- Purpose (e.g. formative, summative, diagnostic)
- Use (e.g. instruction, grading, compliance)
- Number of assessments
Another important step as you inventory your assessments is to find your scope and sequence and make them available. You might not call it “scope and sequence” in your district, but these are the documents that outline what standards should appear for each assessment. This might be on a unit-by-unit basis, or a historical look at released standardized assessments. You’re going to want to reference these documents in the next step.
Completing this inventory will first help you decide which assessments are relevant to the goal you identified in step 1. It can be easy to assume that after identifying the goal, you don’t need to do an inventory. You probably already know what assessments are important to that goal. However, it’s always possible to identify assessments you weren’t even aware were being delivered. Some schools have their own programs or initiatives that are different from other schools. Some departments may deliver assessments that are not connected to the curriculum and instruction department, which may impact how the goal is assessed. Take a deep dive and figure out what’s being given, where it’s being given, why it’s being given, and how it can help us determine if we’re meeting the goal.
This step in the framework could be the goal, or it could be one of several goals in your assessment program evaluation. The idea is to take a dive into each assessment type you identified before and determine if the assessments are aligned to the standards (and, if so, how well). This can be done in a number of ways, but one of the best ways is to look at the test data for assessments you’ve already completed. If you’re wanting to evaluate assessments that haven’t been delivered yet, we’ll talk about that in a moment.
Examining Depth of Knowledge alignment with standards expectations
In Aware, head to Single Test Analysis and find the data for the assessment you’re wanting to evaluate. After finding the test, move to the learning standard summary tab, where we’re going to begin identifying trends and asking questions. When looking at the learning standard summary, you’ll get a quick overview of performance for each standard assessed in the test.

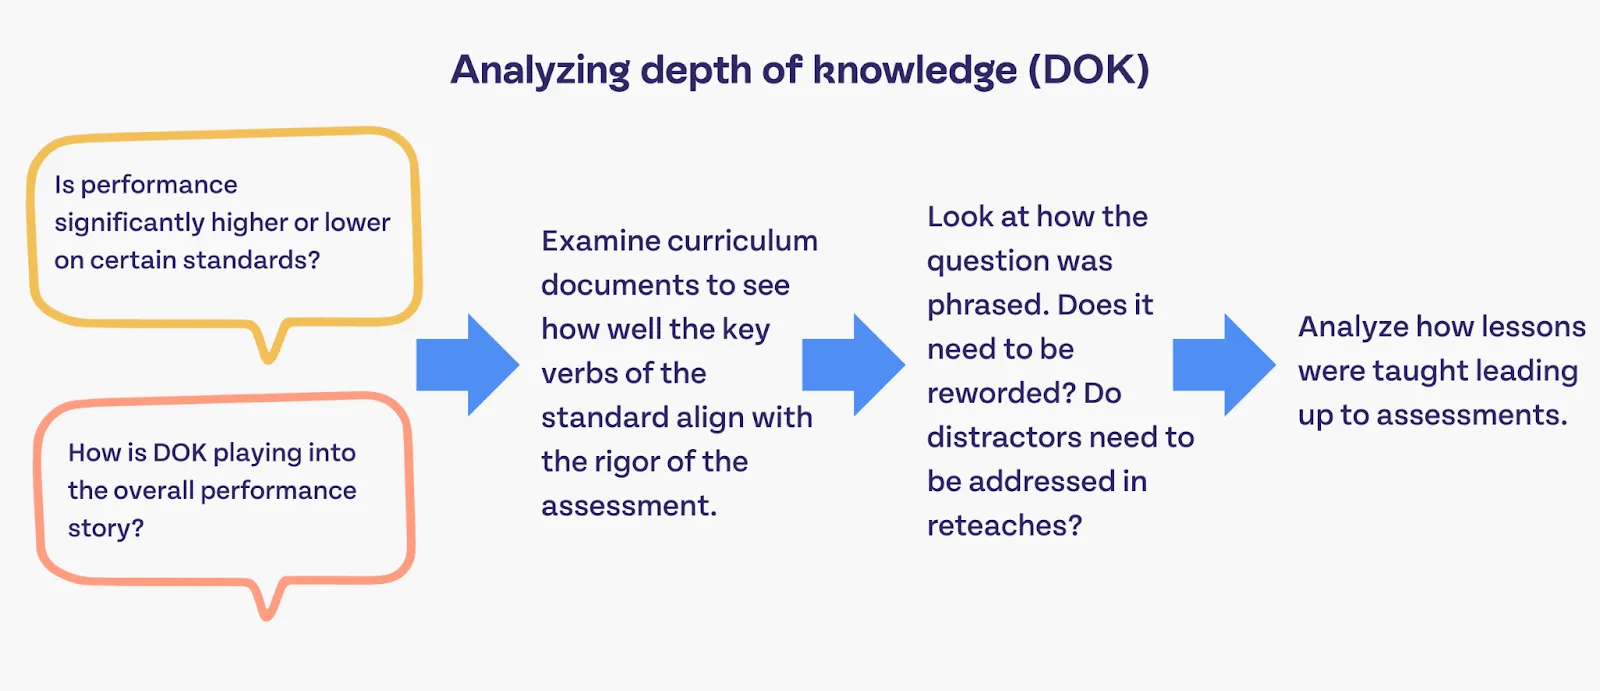
Here, you’ll be provided the opportunity to search for interesting trends in the data. While looking at this table, I might ask myself: Are there any standards performing significantly lower or higher than the others? How is Depth of Knowledge playing into the overall performance? Are all of the standards present that should be? You may find several more questions to explore as you’re looking at the table. What stands out to you when looking at the data in the picture above?
For me, the first question I asked was for 5.3.G. Why are the DOK 2 questions basically bottomed out and the DOK 1 questions doing significantly better? This would lead me to my curriculum documents to look at the standard itself. I’ll be looking at the key verb for the standard and trying to determine the expected rigor for this standard.
If the verb is something like “identify” or “describe”, then DOK 1 questions are likely appropriate. This might mean that the DOK 2 questions tied to this assessment are inappropriate and could be removed or need to be reviewed. If the verb is something like “analyze” then DOK 2 might be more appropriate. With DOK 2 doing much worse than DOK 1, that might mean I need to review the DOK 2 questions to ensure they’re well written. It might also mean I need to take a deeper dive in a PLC-type setting and ask about how lessons were taught related to this standard and these questions. Are the students prepared for these questions? Are the questions filled with distractors that need to be addressed?
From here, I’ll move into the Item Response Analysis tab to look at the questions for that standard.
Identifying problematic test items
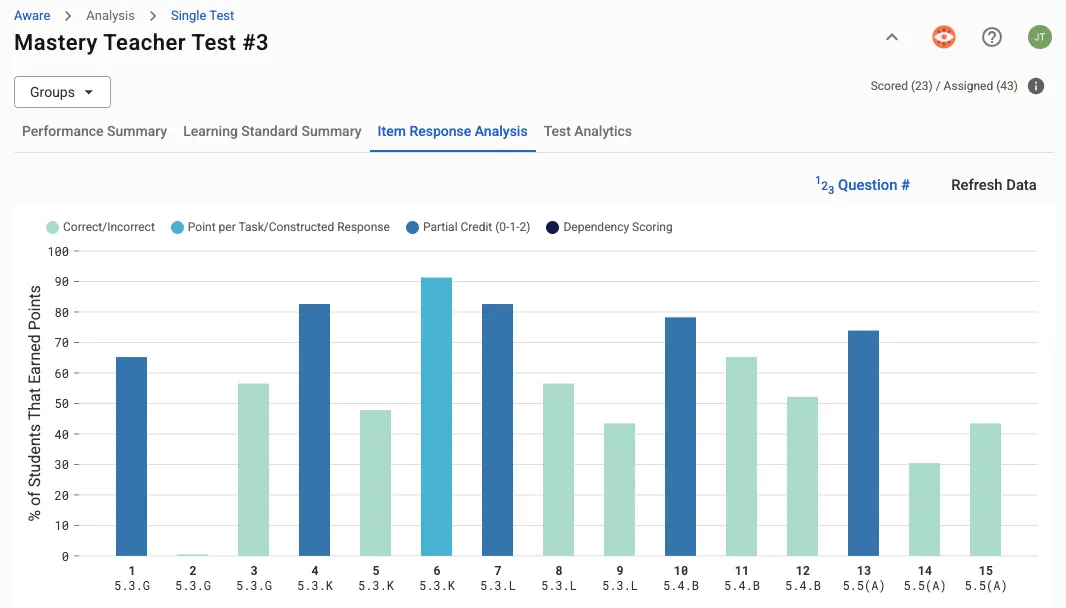
In the above graphic, I can see immediately that there are two questions that address 5.3.G. One of them has a performance level more in line with the other questions, and one of them is completely bottomed out. Something is probably wrong with the question. To dig in further, I’ll click on number 2 and look at the question itself.
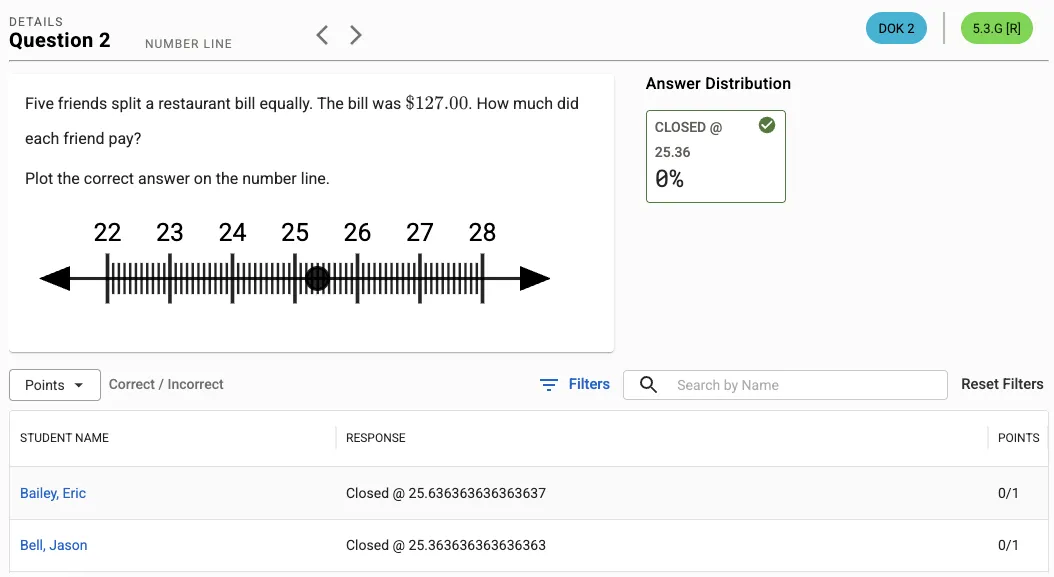
Here, I can see that the question is asking students to determine how much each friend needs to pay. However, they’re trying to plot the response on a number line. The problem here is with the item itself! It’s extremely difficult to plot the correct response for this question on a number line. The correct answer isn’t even the actual correct answer. My conclusion is that this question needs to be revised and reassessed to fully understand if students have mastered this skill. If this problem hadn’t been identified, how might that have impacted the district’s understanding of the students’ performance with this standard? How could that have impacted remediation or acceleration?
This is just one example of potentially endless ways to utilize Single Test Analysis to jump between the Learning Standard Summary and the Item Response Analysis tab. I can use the visuals to identify interesting places that warrant further investigation. I can use the question preview and data to dig into the root of why the performance is interesting and draw conclusions.
Another powerful way to use STA’s Item Response Analysis tab is to look at the answer distribution to determine if there are any distractors that need to be analyzed for revision.
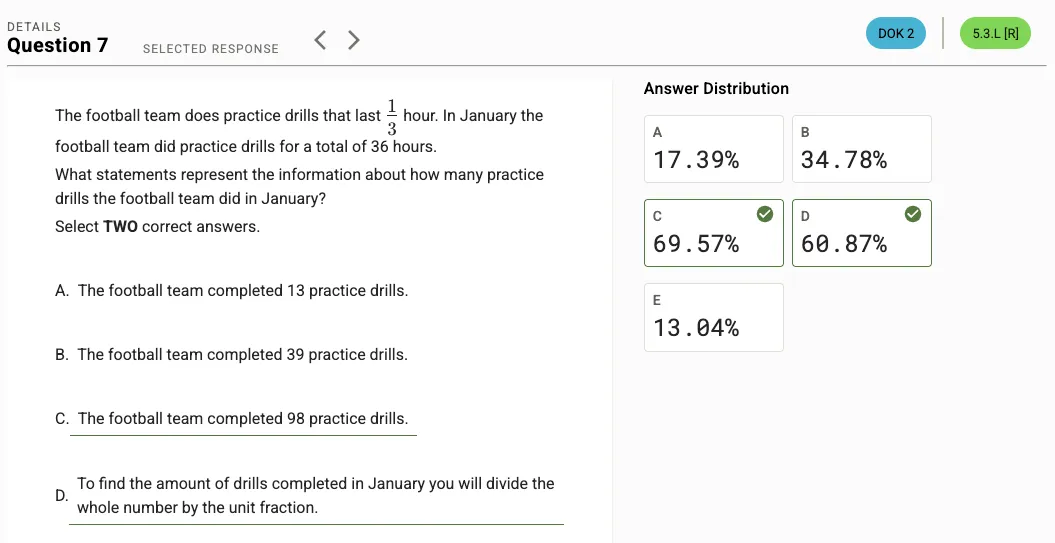
In the above image, I can see that a little over a third of the students picked the same incorrect answer choice. I can review the question and the answer choice to determine if students might be making the same mistake. I might then work with teachers in a PLC setting to decide if some deliberate remediation will help, or if there’s a problem with the question itself. Sometimes, distractors are legitimately too distracting.
Common Assessment Pitfall: Use the DOK and standards comparison from your curriculum documents to analyze each question and make sure there’s a DOK alignment across assessments. Often, we find that assessments are expected to assess a standard at the DOK 2 or DOK 3 level, but all of the assessment questions are at the DOK 1 level. This would be a misalignment in the standard despite an alignment on the content. If the students are only ever exposed to DOK 1 questions and tasks, they will struggle with meeting the expectation and rigor of the standard.
Student mastery is a topic that is closely related to alignment and rigor but is analyzed in a different way. When determining student mastery, we can approach it from two different perspectives.
The first is the most common and easiest to analyze: Did the students get to at least x% in their performance on the standard?
Analyzing mastery based on the rigor and DOK of an assessment item
That percentage can be almost anything you want it to be, and can vary from content to content or grade level to grade level. For example, mastery might be 70%, depending on the person or the situation. However, a standard that is a very high rigor might have a mastery threshold of 60%. Conversely, a DOK 1 standard may need an 85% threshold for mastery. Conducting this evaluation could be as easy as using Quick Views or Single Test Analysis to identify individual questions where the bar or percentage is above the threshold assumed for each standard on each assessment.
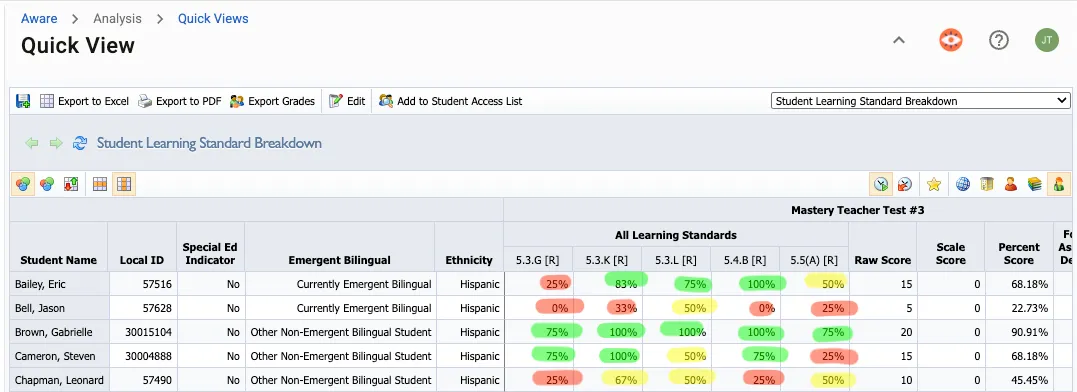
As an example, I might print out the quick view and highlight the standards in various colors depending on their proximity to the “mastery standard” that I’ve set. The above picture is how a teacher might do it for a class of students. A curriculum director might do this at a more macro level, looking at district or school-level summaries.
Awarding mastery based on anecdotal data
The second method is more involved but also more authentic. What does the teacher's data and anecdotal information say about the individual student's mastery of the standard? This method of mastery analysis can be done in the Student Mastery Tracker.
In Student Mastery, a teacher will create a Mastery Tracker that is updated on an ongoing basis throughout the year. As assessments are taken, they will update the perceived mastery level of each student for each standard. The nature of the tracker allows the teacher to apply their perceptions for students who demonstrate mastery in both traditional (paper or online assessments) and for students who demonstrate it in more unique ways (performative or observational).
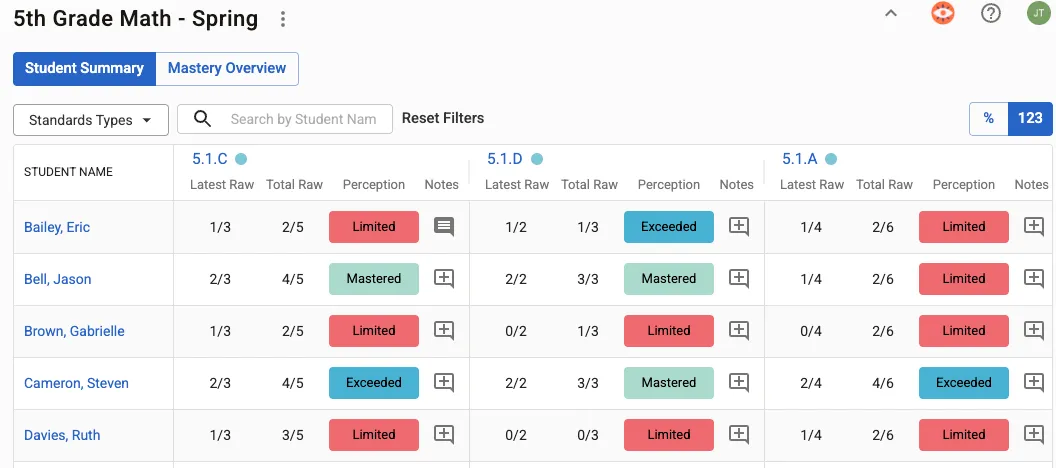
In the above example, we can see the teacher has determined the perceived mastery levels for each student and each standard. The latest raw score can provide valuable insight compared to the total raw score. The power of this kind of analysis allows the teacher the flexibility to decide that out of the 5 times this question was asked, they didn’t get it the first several times, but knocked it out of the park the last two times, then that demonstrates mastery. This might mean intervention has worked. This shows a more complete story that performance thresholds might miss on an average analysis.
From an administrator perspective, the real value to determine student mastery across assessments is with the mastery overview.

Assessing mastery perceptions at a high-level overview

Here, I can see how students are distributed for the teacher across the mastery perceptions. This will help me ask important questions like, ”Which standards are showing the lowest level of mastery?” and “Which assessments have those standards on them?”
Once I have a list of assessments for those standards, I can dig deeper by finding those assessments in STA or Quick Views. I might also ask, “Is there a mismatch between what STA and Quick Views are showing me compared to what Mastery is showing me?” If so, why could that be?
Is it because the teacher has a more nuanced understanding of the student, using more recent data compared with the last time the standard was officially assessed by a district assessment? Is the teacher’s understanding of mastery for this content aligned to the standard’s rigor and what the assessment is expecting?
Comparing performance trends is a powerful way to look across assessments at high levels to determine alignment (or predictiveness) in performance from test to test or test type to test type. This can be really difficult to do without data analysis software, but Aware makes it a cinch with Quick Views and Multi-Test Analysis.
For example, when doing an assessment program evaluation, you might be interested in determining if your local assessments are predictive of the STAAR test or if the MAP assessments you’re paying for are predictive of performance on STAAR assessments. Let’s start with Multi-Test Analysis.
Comparing years-long assessment trends with Multi-Test Analysis
Multi-Test Analysis lets data administrators create progress profiles by stacking assessments on top of each other, creating customized performance thresholds across achievement levels, and comparing assessments as closely as possible. When configuring the performance thresholds for potentially unlike tests, you can narrow the field of comparison without invalidating the actual assessment scores.
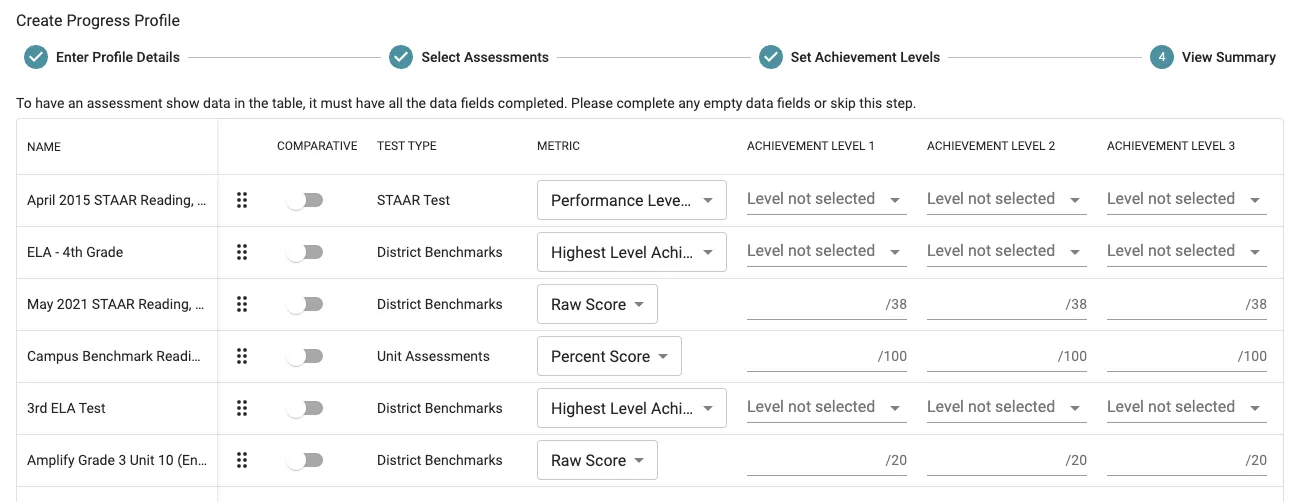
We can see in the example above that I’m able to pick which metric for each assessment I’d like to compare, and then set the thresholds for each of the achievement levels I’d like to compare. Once configured, you get a data visual that looks a little something like this:
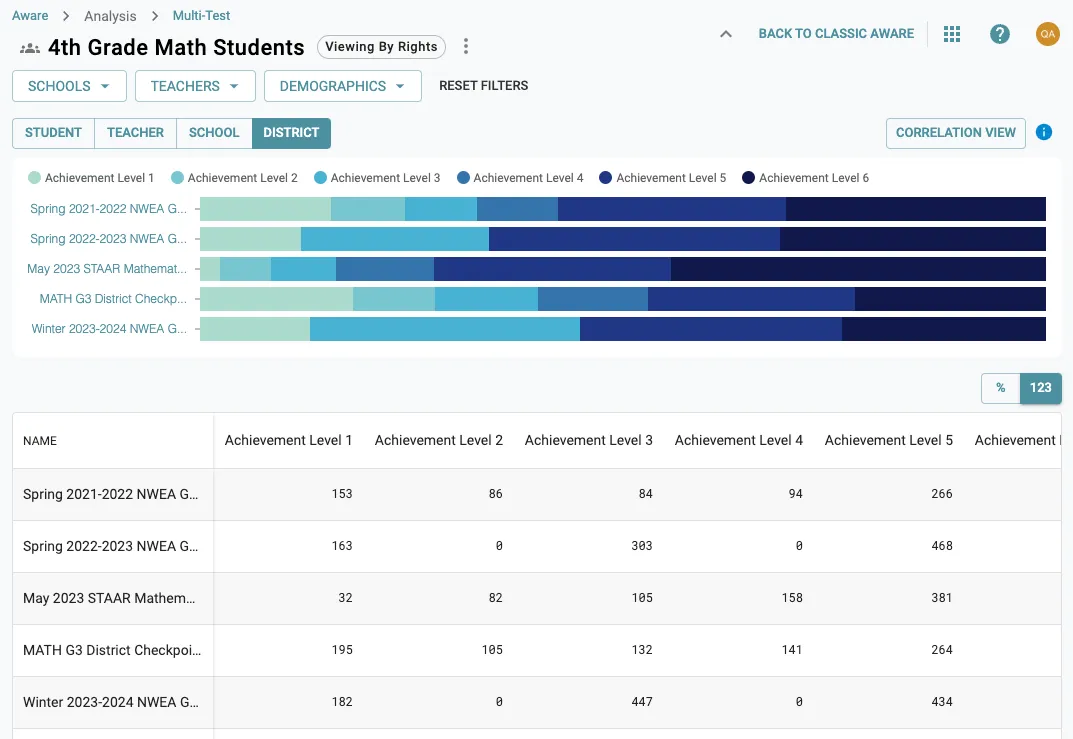
The horizontal bar graphs allow me to see a really quick comparison across assessments. In theory, if all tests are aligned in rigor, content, and expectations, then all of the bars should be roughly equal to each other.
At a glance, I can tell that the May 2023 STAAR tests had some serious improvements in performance with more students in the 3rd, 4th, and 5th achievement levels compared to other assessments. This kind of visual analysis lets me ask some high-level questions right away, such as:
- What may have caused the 2023 STAAR to outperform the others?
- Was it intervention?
- Why is the winter 2024 NWEA assessment performing so much lower than the 2023 STAAR?
- Is there an alignment issue?
- Is there an instruction issue?
- What are our local assessments telling me, and should I add them to this progress profile to check?
If I stacked up all of the 5th-grade math unit tests for the entire school year, I might see performance drift over time one way or another. I could stack up all unit 1 assessments for 5th grade math for the last 6 years and do a similar drift analysis. The point is, how is the performance changing from test to test (alignment and predictiveness) or how is the performance changing over time (drift)?

This level of analysis lets you find interesting trends that will lead you to specific assessments that could be analyzed deeper in something like Single Test Analysis. Deeper than that, though, I can use MTA to look at the growth of students over time by achievement level.
Selecting the Student List view allows me to see how individual students perform over time across a variety of assessments. This can be essential when doing demographic-level analysis to find bias in your assessment program or to target specific assessments that need special attention (identifying causes of drift over time).
These comparisons are also very useful for school and educator-level summary views, helping you to ask specific questions about performance across schools or across teacher groups. When evaluating your assessment program, consider using all of these lenses we discuss in this article to get the most thorough understanding of the possible health of your assessments.
Multi-Test Analysis also offers the Correlation View to provide a correlative understanding of the predictiveness of your assessments. In the progress profile configuration, make sure you’ve selected one assessment to be the comparative assessment. Then use the correlation view to see the correlation scores for each assessment compared to the assessment you selected.
As an example use case, you might choose the most recent STAAR test as the comparative assessment, and then see how every other assessment in your progress profile compares to that STAAR.

In the above example, we can see that the first assessment in the list had a correlation score of 0.35, indicating a not very strong relationship between the two assessments. This might imply that one is not very predictive of the other. Similarly, the Math G3 District Checkpoint shows a stronger correlation score, possibly indicating that the predictiveness of these two assessments is more closely aligned. This might cause me to ask myself what changed over time that created the differences? I might stack up more local assessments and ensure that they all are as predictive as I’d like them to be. If they aren’t very predictive, there might be problems with rigor, standards alignment, depth of knowledge, or even bias from something like instruction or distractor answer choices in some assessments.
With the correlation view you also have the achievement level comparison view. This view shows the differences in the spread of achievement levels from the comparative assessment to the other assessments.
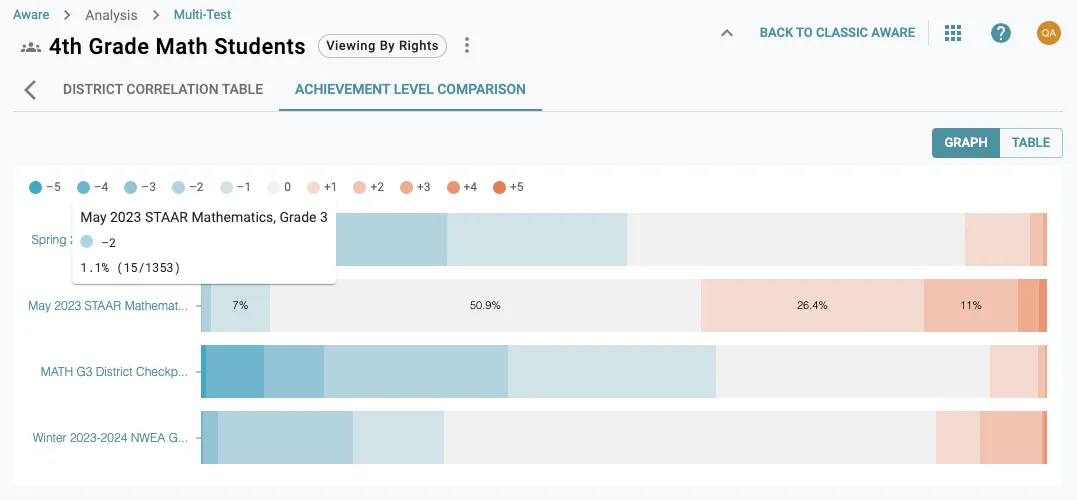
In the above example I can see that the second assessment tended to have students perform at one or more achievement levels higher than the comparative test. However, the one below that shows that the majority of students performed one or more achievement levels below the comparative assessment. This could be another visual indicator of an interesting trend that might cause me to ask more questions, or indicate that I need to do a deeper dive into Single Test Analysis for this specific assessment.
Using Quick Views for a standards-level achievement comparison
Now let’s dive into Quick Views for a similar kind of comparison but with a more nuanced approach at the standards level. Quick Views has the added benefit of being able to build a cross-test view that includes standards. This is really powerful when trying to see how standards performance shifts from test to test, or across an entire year. Building one is as simple as adding however many tests you need to the quick view (but be careful, as adding too many just makes things difficult to manage).
In this Quick View, I’ve loaded 3 formative assessments and one summative that covered similar standards. In my analysis, I’ve selected the “student learning standard breakdown” as my view type, and I’m moving back and forth between assessments, reviewing how students performed on each standard. I’m looking for patterns in performance, taking note of standards that are drastically different from the formative assessments to the summative assessment.

An example of two that stand out to me is 5.3.A and 5.3.E. There’s a nearly 20-30% decrease in score from the formative assessment to the summative assessment. There are a number of possible explanations, but I may be asking myself questions like, “How were students prepared for the formative assessment versus the summative?” “What local practices in the classroom may have impacted the performance?” (Such as test review, immediacy, or instructional implications) “Do the questions for both assessments need to be reviewed for alignment, rigor, and distractors?”
While doing this analysis, I also noticed that the summative assessment has a number of assessed standards that aren’t on the formative assessments. Similarly, the first formative assessment in the view has no standards in common with the summative.
These are gaps to review and correct.
There are more things we could get into, and we may review some of them in part 2 of an Assessment Program Evaluation post. However, these high-level tasks are an excellent place to begin your Assessment Program Evaluation as a whole.
With the analysis complete, it’s time to make recommendations for modifications to assessments. This process can be as formal or informal as is necessary for your particular district. Some districts tend to have more processes in place to ensure changes are reviewed and approved before being made. Others may not have those processes and tend to rely on a much smaller curriculum and instruction department to make these kinds of decisions. In either case, it’s time to synthesize the data to make decisions.
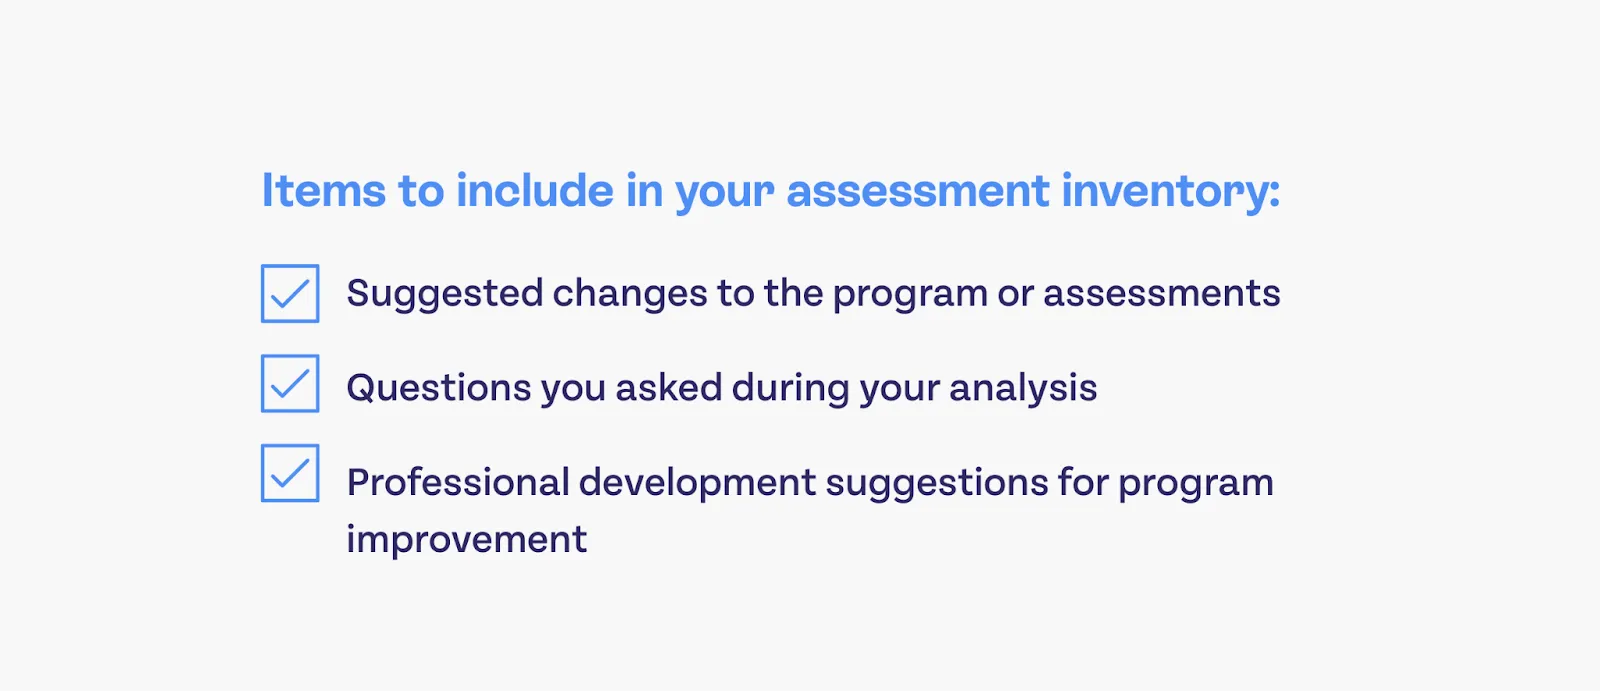
Based on the findings, my recommendations may be put together in a report or presentation highlighting the data and conclusions I’d written as I went. In the assessment inventory where I write my suggested changes, I’d create a log of the questions I asked next to each assessment item. These changes ranged from DOK review and modifications to distractor answer changes to identifying missing standards between assessments. Some of my suggestions may eventually build towards Professional Development ideas that could be provided to staff members to improve instruction for particular standards or to pull in teams of teachers to review assessments and collaborate on planning.
At scale, if my analysis identified large gaps in practices, I may even make recommendations to create new policies or guidelines for assessment review, building, and delivery moving forward. These recommendations need to be reviewed by a larger group (maybe not much larger, depending on district size) to align on the objectives, the data, and the decision points.
Whether you’re making small assessment changes or large policy reformations, create a plan that can be executed and is easy to follow. Be cautious about overcommitting to too much change. Often, simple and slow changes are easier to digest and execute than large, sweeping, and fast changes.
Big change is difficult to accept for the teachers responsible for following those changes. Choose wisely, and at the very least, create plans to align everyone on the principles and data guiding the decisions.
With plans in place, the last critical step is to communicate the plan to all stakeholders. The stakeholders will be curriculum coordinators, instructional coaches, principals, lead teachers, and anyone else deemed necessary to coordinate and implement the plan.
Communicating the plan must be accompanied by a transparent showcase of the data that was identified to make the decisions and the plan. Providing the “why” connected to the plan will help bring people on board with executing the plan. These kinds of changes should never be compliance-driven and should always be collaborative as much as possible (understanding that not everything and every step can be collaborative). In this setting, establish a loose plan for how monitoring change will occur. This will generate additional buy-in as stakeholders are given a feeling of consultation on the plan rather than simply being told “this is the plan.”
Monitoring should include periodic check-ins with reports on progress. Only things that are monitored are ever fully executed. This cannot be ignored and put on a permanent back burner, or it will never be fully completed. Smaller changes can likely experience their entire cycle of identification, analysis, planning, communicating, and executing in a matter of weeks or months, whereas larger changes will take a full school year. Ensure the correct resources are allocated to make the efforts as successful as possible.

There’s quite a bit more that could go into this process, but this framework provides a general approach that could still be applied even beyond the scope of what we’ve covered today. Make sure you move deliberately by identifying a goal, inventory your assessments, double-check the standards, analyze mastery, compare performance vertically and longitudinally, make a plan, and execute the plan. Easy, right?! (It’s only 7 super nebulous steps, no big deal).
If you’d like a visual reminder of these program analysis steps to print out and keep as a reference, we’ve created a PDF that you can download, share, and print. If you found this resource helpful, you might want to subscribe to our newsletter. We share resources like this one every month, so you’re never out of touch with our software or with data analysis best practices.
Click here for our downloadable "7 Steps" PDF

.png)

.png)