.webp)
Download the E-book for easier reading:
E-book: Data 101 for new and developing administrators
Watch part 1 of our Data Playbook webinar series:
The Administrator's Data Playbook: Crafting a Data Philosophy
Introduction
There’s no single path to becoming a school administrator, but it’s becoming increasingly common for teachers to step into their first administrator role with no training and no idea what to do! If that’s you, how’s that imposter syndrome coming along? Feeling overwhelmed, underqualified, and in need of support? If so, we’re here to help.
We know that you can step into your new role with confidence, especially when you’ve got the basics of data collection and analysis down. So, that’s what we’ll be covering in this resource.
If you’re interested in software that can house your data, generate data visualizations, display reports, and assist in your data analysis routine, then Eduphoria has solutions for you. For now, let’s talk about what you need to know to succeed in your position, software or no software.
Tracking down your data
It’s a small thing, but if you’ve never been in this position before, you may not know where your data is housed. Ideally, you have a data warehouse, but many schools are still keeping their data in spreadsheets, filing cabinets, and unique programs with their own log-ins.
So, step one? Get your log-ins, find your data, and find out who you need to ask to get your hands on the numbers.
Step two, figure out how your teachers and staff are collecting data. The place where the data lives doesn’t necessarily tell you how your teachers are gathering their data. They may be using a program, or they may be doing a lot of superfluous work, manually inputting scores and tracking progress.
While you’re undergoing this process, take notes. How difficult is it for you to find and analyze data? How difficult is it for your teachers to gather and input that data? If you’re noticing significant difficulties, (including a time-consuming process) then one of your goals could be to improve upon this system.
After all, if your process is flawed, then more effort is being put into documentation and less time making an impact on student and teacher growth. In terms of how you’d be able to improve this process, we’ll talk about data philosophy later on in this resource.
Classifying and prioritizing data
Whether you are new to this role or not, you probably have big dreams about making big impacts. You wouldn’t be in this position if you weren’t a go-getter with a passion for education! Unfortunately, a widespread, overambitious initiative can contribute to overwhelm, burnout, and the diluting of effort and resources.
We recommend getting a global or 30,000-foot view of the state of your school or department before establishing your list of priorities. As a leader, you may have an area of focus you want to address, but being data-informed will greatly assist in discovering your best, first step in terms of areas to address.
You may even be unaware of the kinds of data you should be looking into. For a start, here are some of the most important sources of data to dredge up:
- State assessment scores
- Graduation rates
- Attendance, truancy, and tardiness
- Teacher evaluation scores
- SAT, ACT, or PSAT scores
- Department-level trends and performance
- Demographic data
Before you dive in, it’s time to ask some questions to drive your analyses.
Questions you should ask to focus your data analysis
Depending on your role, your focus and impact will be very different. You may not even have access to some of the data listed above. That being said, it’s a good idea to ask these questions before you start your initial data collection and analysis process:
- What kind of data would be most useful for your role? There are many different kinds of administrative roles, and some of them are specific to each school or district. The kinds of data that a curriculum coordinator would need are very different from the data a rostering administrator might need. If you’re unsure of the kinds of data you need to audit departments and accomplish your goals, then connect with someone who is more familiar with your role. They can guide you toward high-priority data.
- What is my perception of the problems and needs in my community? Your perspective is important, especially if you’re moving up from a teaching role and have “insider” information on what staff and students are dealing with.
- What are the needs that students and teachers frequently identify? If you don’t have this data, we’ll talk about how you can gather this information later on.
- What kind of data are teachers analyzing regularly to inform instruction? Am I able to see that data? This information could give you insight into the health of your curriculum and assessment program while also shedding light on trends in student support needs.
- What’s the biggest need and what’s the most achievable need? You could establish short and long-term goals by teasing this out. Once you have goals in mind, it’s easier to tackle data in a meaningful way. Quick, small wins can also help establish you as a trustworthy leader, setting the stage for larger, more difficult changes later on.
The biggest question here relates to your role. So, while we can’t spend too much time going over all the data specific to each kind of administrator role (especially considering the nuances and differences between these roles by region), here are a couple of examples of how your role may influence the kind of data you seek out.
Principals often focus on managing other administrators, student growth initiatives, and accountability. They may focus on school-wide assessment data, then dig into demographic data to determine gaps in instruction and curriculum that may adversely affect certain student groups.
Assistant principals often focus on major behavioral problems and evaluating teachers. Their data priorities may lean on teacher performance, truancy, attendance, and drop-out rates.
Curriculum coordinators typically organize, fine-tune, and implement curriculum initiatives. They might find assessment data, professional development data, and demographic data helpful in identifying program strengths and improvement areas.
What do I do with this? Starting your data analysis
So, you got your hands on the numbers, now you need to figure out what they’re saying. If you’re doing this manually, looking over spreadsheets, or even collecting the information yourself…again, take notes.
Who did you have to ask for information?
Who else is looking at this data?
What parts of the process could be streamlined and expedited?
What are the different ways that the data was aggregated–can you create a common format and expectations that would make it easier to analyze?
Now, if you’ve never done data analysis before, take a deep breath. A lot of people don’t even make it this far. You’re doing a great job, and we’re going to take this one bite at a time.
Bite one: Identify trends
A trend can be positive, negative, or neutral. It simply points to something in the data that may become significant.
So, how do you identify trends? Look for these things in the data:
- Do numbers increase or decrease over a certain period of time?
- Does it look like certain triggers drastically affect the numbers, causing a sharp increase or decrease?
- Is there any data that doesn’t seem to increase or decrease?
Here are some hypothetical examples of how trends may appear in the data:
- State assessment scores increase over a period of four years.
- Teacher evaluation scores have no discernible trend, neither increasing nor decreasing.
- Truancy decreases over a period of two years.
- Tardies decreased after implementing free breakfast.
- 10th-grade English scores decreased after returning from virtual instruction.
Now’s not the time to draw conclusions. Right now, you’re just stating the trends as factually as possible. Don’t make inferences. Simply state what the data is doing.
Bite two: Identify outliers
Trends typically encompass the majority. For example, you’re going to pick up on trends if there are large groups to which the trend applies. While you may start an “initiative” to tackle a trend in the data (pointing to a larger problem or need), outliers require targeted intervention or praise.
Now, it’s time to look at that data that lives outside of the majority–the outliers.
Here are some ways to identify outliers:
- If the majority of data is increasing, but some is decreasing, pull those that are decreasing aside for further analysis.
- Find the highest and lowest values or groups of values, especially if there are fewer of them than are in the majority.
- Find single data points that aren’t part of a larger group.
- Plot your data on a graph to visually see the outliers, especially if you’re dealing with large sets of data.
Here are some hypothetical outliers and how they would show up in the data:
- All Science Teachers in the department have improved in evaluations year over year except for the 9th-grade Science Teachers.
- English Language Learners score in the lowest percentile on English Language Arts (ELA) End of Course Exams.
- Black and Hispanic students participate in college readiness classes 3 times as often but are rewarded scholarships 50 percent less than Caucasian students.
- Female students participate in extracurricular activities significantly more than their male classmates.
- The Robotics team receives the least in funding but has the highest participation rate from active members.
Again, this isn’t the time to make conclusions. While some of the example outliers combine two kinds of data, it’s okay if yours doesn’t. It is a more advanced step to be able to combine two sets of relevant data.
However, if you want to find these interesting data cross-overs, this is where you’ll get some of the most nuanced and specific information. Programs that help you run reports or data visualizations would be very helpful in finding these areas of crossover.
Bite three: Articulating the problem areas and causes for celebration
Now, it’s time to apply meaning to the data.
Let’s say you run a report on teacher evaluation scores in your district. All things being equal, every school should have an equal distribution of talent. Yet, you discover that some schools have much higher evaluation ratings than others.
Looking further into the data, you discover that not only are there inconsistencies across the district, but there are inconsistencies from year to year, so scores change without significant improvements or failures in the classroom.
If you were looking into data like this, what would this information tell you?
Dr. Jeremy Wagner, a former district administrator out of Texas, wrote a resource on how he solved this exact issue in his district. He found that a lack of continuity between schools made it impossible to compare data. He decided that they needed a shared evaluation document.
Next, he used the data to determine that appraisers weren’t being trained to assess their staff accurately, resulting in widespread bias that skewed evaluation ratings.
Using the reports he ran, he identified the problem and set a course for correcting it.
That’s a cause for celebration in itself; however, reports can and should also be run to articulate areas of success in your school or district.
What if the data is telling you that ELAR state assessment scores have improved two years in a row because of a new reading and writing after-school program? That’s a BIG win. That deserves to be announced, celebrated, and even rewarded. Plus, the administrator who discovers this win should congratulate those who are contributing and build on this success for years to come.
How do I know what normal is?
When analyzing data, it’s essential to know what “normal” looks like before drawing conclusions about trends and outliers. Sometimes a trend, though the data is increasing or decreasing, is perfectly “normal.” Normal doesn’t necessarily mean good or bad, it’s just the baseline of what’s currently occurring.
That’s why it’s helpful to have more than one year of data to go by.
For example, our Multi-Test Analysis tool enables select school and district administrators to compare assessment results over a longer period of time. This allows them to determine their “norms” and even evaluate strengths or flaws in their assessment program based on deviations from that norm or standard. They can also compare assessments to their state exams to see which tests are too easy, too difficult, or best aligned with state standards.
Let’s say you don’t have software that can help you identify your norm. Here are some tips that may help you find and aggregate that data:
- You can use spreadsheets to emulate complex programs like Multi-Test Analysis to analyze your assessment programs.
- Finding trends in assessment data is easiest when there are district common assessments. Line up assessments in a data analysis software, or export to a spreadsheet using common assessments across multiple years (i.e. identify a grade level and content area, then put 3 years of unit assessment data next to each other), graph it, and see what the trends are. Be sure to separate it out by demographic so you can see trends. Do it also by school if you have more than one in your data set. Going beyond 3 years doesn't serve much purpose other than providing "more information overload." You shouldn’t look into your rearview mirror while driving for more than a few seconds at a time, or you risk driving off the road.
- Do the same thing with state assessments. Pick a grade level and content combination, line up 3 years’ worth of data, and look at the patterns. This will help you define what the trend looks like if there is one. Again, do this by demographic and school.
- Do this one unit at a time. Putting Units 1, 2, and 3 side-by-side doesn't help much with historical trends but instead tells a different story. Put unit 1 for this year next to unit 1 from last year next to unit 1 from two years ago. This only works if the standards are the same for that length of time and the units haven't moved in order.
- In districts that do not rely on common assessment practices, this kind of analysis is more difficult. You have to do the analysis with each school independently, and you cannot make assumptions about commonalities across schools. Each school is its own kingdom of data.
- If you need a really quick assessment of some trends, utilize the reports provided to you by your state, such as the B.E.S.T reports. These can give you some high-level data on the state assessments and performance and serve as a point of reference for your own trends.
- Utilize your teachers’ professional learning communities to collect data relevant to their department (such as district assessment scores), then encourage them to bring it to an all-hands meeting where that data can be digested under your guidance and shared with the appropriate parties. This would also be a good time to start teaching and reinforcing good data philosophy and practices.
- Speak to the professionals at the head of each department where the data that you need is stored. They may also be lacking data analysis guidance, so the first step is to figure out how you can share data and work together to figure out a procedure for future collaboration.
It’s possible that by reaching out to the professionals who have the data you need, you will discover professional learning needs that can help you establish processes and procedures. For example, if you need your rostering administrator to regularly provide information about staffing needs, and spreadsheets are the preferred method, but they don’t know how to use them…it may be time to develop a course or conference that can teach your team to use the tools that are best for your process.
Procedural norms are just as important as data norms
You may have gathered that the processes and procedures that are central to your role are going to play a part in your data analysis routine whether you like it or not. Therefore, to make changes and inferences about your processes and procedures, you should gather some information that will help you determine the norms for these things as well.
Here are some tips:
- Take advantage of (or implement) a mentoring/cohort program in which new staff members are paired with veteran staff members who can provide information on their new position.
- Establish standards for a regular meeting cadence in which mentors and mentees can meet and discuss problems, answer questions, and hash out documentation needs that could help your school determine process norms.
- Ask these groups to document gaps in communication, resource allocation, and knowledge that could be solved through program initiatives such as professional development or data warehouse implementation.
- Bring these groups together to discuss procedure needs that could be solved through collaboration or common software uses (rather than each department using software that’s unique to their roles but inaccessible to others).
It’s worth noting that a school’s culture can meaningfully impact information sharing and data gathering. If the culture needs to be cultivated and nurtured, then information may be much harder to come by.
That’s why it may be helpful to conduct surveys among students and staff to collect data about the “feelings” surrounding the school's day-to-day function. Surveys can also be used to gather baseline information about common practices and procedures among departments.
Developing your data philosophy
Throughout this resource, we’ve hit on a few pain points that feed into the development of a data philosophy. If you have determined inefficiencies in your data collection and analysis process, then you’ve found essential building blocks for your data philosophy.
If you’ve determined areas where communication could be improved so teachers know who to give and get data from, then you’re working towards a data philosophy.
Before we get into how you might create your own data collection and messaging framework, let’s look at the problems of a system without a data philosophy and what a data philosophy is to a school community.
Have you ever experienced this?
As an employee of your organization, you know basically what the school or organization does that you’re a part of. However, your expertise is pretty limited to the role you’re in.
Suddenly, a demand comes from up top. Perhaps it slips into your inbox at the end of a long day. Perhaps your supervisor stops into your office for a brief, verbal exchange.
The message? A higher-up has asked you to perform a complicated task, provided no deadline, marked the task as urgent, and given no clear direction on how that task should be achieved or why it’s being assigned.
What’s the normal reaction to a demand like this? Anxiety? Overwhelm? Frustration?
In a school setting, this is similar to what happens to a teacher who is asked to collect and analyze hundreds of assessment scores without clear direction on what to do when they’re done. Data analysis is a monumental task! Especially when lacking context.
Context is essential for everything a supervisor asks of their employees, and this remains true in your school. One way that administrators can develop this context and save their staff some frustration is to develop and share their data philosophy. This will be the context that enables you to make widespread change throughout the school.
What is a data philosophy, exactly?
When new houses need to be built in an up-and-coming neighborhood, homebuyers can’t just camp out, buy the materials, and start building wherever they want, right? There are guardrails in place and people to talk to that make the process safer.
Oftentimes, there are even restrictions that keep people from going too far off the rails with the design of their homes. They need contractors, permits, architects, bankers, and city planners involved in the process. At the base of it all is a philosophy. Each neighborhood has rules, sometimes to keep it uniform, most often to keep it safe.
Which street corners need stop signs as opposed to yield signs? How far from the street should the houses be? How wide are the sidewalks? These are important considerations that contribute to a well-functioning neighborhood.
Now, you have the rare and unique opportunity to establish or revise the rules that will help your teachers build something that’s “up to code.”
And you’re the code writer.
If that scares you, take a breath! You don’t have to build your data empire in a day! We wrote a comprehensive resource on data philosophy, but we’ll summarize some of the more important points here.
10 Essential steps to building a data philosophy
This is a complex topic that can’t be fully encapsulated with a list, but we believe that these ten steps summarize a great deal of the work that would go into this process.
- Establish a goal that will drive the actions of your staff, e.g. building better assessments, driving student growth, improving teacher evaluation scores.
- Create your dream team of data collection and analysis gurus who can help you teach and practice your data philosophy.
- Write a list of objectives that align with your goal.
- Order your list of objectives according to need and priority.
- Draft a list of beliefs that are driving your data philosophy, such as, “I believe that students deserve access to and control over their data.”
- Create a messaging framework that will help spread this philosophy and your data practices among staff and students.
- Send regular reminders, create posters, and use whatever messaging you have available to change the culture and mindset to support your philosophy.
- Establish procedures that eliminate kinks in the system, streamline the process, and eliminate pain points.
- Reinforce your procedures with professional learning and evaluation criteria.
- Live your own data philosophy in your day-to-day…lead by example.
As Dr. Wagner says, “Follow through. Things that aren’t checked on are optional. Things that are optional often are not done.” While you’re leading by example and sending out reminders, keep in mind that you’re establishing the narrative around data and follow through.
So, what are the benefits of creating, spreading, and reinforcing a data philosophy? Well, you’re making it easier for staff to do their jobs and reach their goals! With clear direction about the hows and whys of data analysis, teachers can make more informed decisions that support students. Department heads can better support their teachers! The opportunities for growth are endless.
Plus, you’re saving time. Time is a valuable commodity in education, and oftentimes, teachers and students are very low on time. By creating more efficient systems, staff in your community can prioritize greater needs, make smarter decisions, and spend less time agonizing over things they hardly understand and don’t really want to do.
Context is a powerful solution to a great deal of woes.
Context is your why, your how, and your what, and that kind of information will improve teacher morale and lower the barrier to equitable information access that can drive growth in your most important domains.
Who should make a data philosophy?
You might be thinking that it’s the principal’s job to make a data philosophy. While it’s incredibly important that your principal has and shares their data philosophy, there are a number of situations in which administrators in various positions should determine their own data philosophies and share the necessary information with their teams.
If you aren’t a principal, let’s say your school leader shares their priority list for data analysis and growth:
- Use assessment data to make tutoring groups that drive progress in Math and Science
- Improve curriculum to better include the perspectives and needs of minority groups, including children with disabilities
- Provide training opportunities for cross-curriculum teaching opportunities that encourage literacy in every subject
We can agree this is a very ambitious list of goals and priorities; however, there’s a lot going on in this list that would require the support and participation of other administrators. There may even be some overlap between goals, so actions taken to fulfill one goal could impact more than one goal (such as improvement in literacy driving progress in Math and Science).
Let's look at goal one:
Use assessment data to make tutoring groups that drive progress in math and science.
Math and science grade-level administrators will need to work with their principal and their teachers to accomplish this goal. If the principal has requirements for data collection and analysis, then grade-level admins can pass this information along and provide the support and assistance needed to make these practices commonplace.
If the principal doesn’t pass along expectations for how this should be done, then grade-level admins and team leaders can and should fill in those gaps.
They can add their own goals:
- Dedicate one PLC meeting a week to look at assessment data, using it to create reteaching and enrichment opportunities
- Create monitor groups after each assessment that make it easier to reteach students with common misconceptions
- Talk with teachers about common problems with curriculum, assessment, and student learning gaps to improve curriculum and assessments
Notice how these goals can be incredibly specific. Thus, the administrator’s data philosophies and procedures can be even more specific than their principal’s.
They can ask teachers to bring assessment data to each Monday's PLC meeting.
They can visit classrooms at regular intervals to monitor reteaching initiatives and provide feedback on the process.
They can build time into their schedules to meet with teachers about their concerns and iterate on the process.
This is a data philosophy!
The right software can make or break your process
If you’ve made it this far into the resource, we hope you’ve added some tips and tools to your belt that can help you make decisions and feel less anxious about the results. We hope we’ve given you the context on data analysis to develop your own ideas and spread them throughout your school, department, or team.
Now’s the time when we get to tell you that software can make your job of collecting data, analyzing it, and making change so much easier.
Because we are current and former educators working with educators, we know a lot about what you’re dealing with. Over the past twenty years, we’ve continued to develop our software to solve the pain points that our customers bring us.
Here are some of the pain points that are frequently brought to us:
- Teachers don’t have time to dedicate to robust test creation and evaluation, resulting in test variability between teachers, departments, and grade levels.
- Teachers don’t have time or guidance to accurately analyze assessment scores, so growth initiatives aren’t driven by student data.
- Curricula are too isolated or too widespread to be useful to a whole team, not to mention it’s impossible to analyze and track for improvement initiatives.
- When software is purchased, there isn’t an adequate amount of training or support for staff to make use of it, so program-wide change is impossible.
- The process of collecting and analyzing data, sometimes within complicated software, is too difficult or too time-consuming to make a difference.
- Data isn’t shareable between teams or departments, or it’s static and immediately outdated once printed and added to a binder, so teams can’t make timely, actionable insights.
- Collecting and analyzing data, sometimes within complicated software, can be overwhelming and time-consuming, making it difficult to tailor instruction for personalized learning.
If any of this sounds familiar, we’re excited to talk about how our software was designed to solve these problems for you.
We can save you time. We can save you effort. And we can make your data philosophy that much easier to create, share, and measure.
Data visualization tools are a game changer
If you don’t have data visualization tools, then you’re probably straining your eyes looking at spreadsheets, or, even more painfully, you’re flipping through a binder’s worth of reports and searching for trends manually.
What if your software could make trends, outliers, and norms into color-coded, live-updated, dynamic graphs that cut hours out of your data analysis routines?
Introducing: Single Test Analysis (STA)
STA was created to make data accessible for teachers, so they can bring their live data to PLC meetings and make data-informed decisions. Because this tool is housed within Aware, our data warehouse, data visualizations are live, dynamic, and up-to-date.
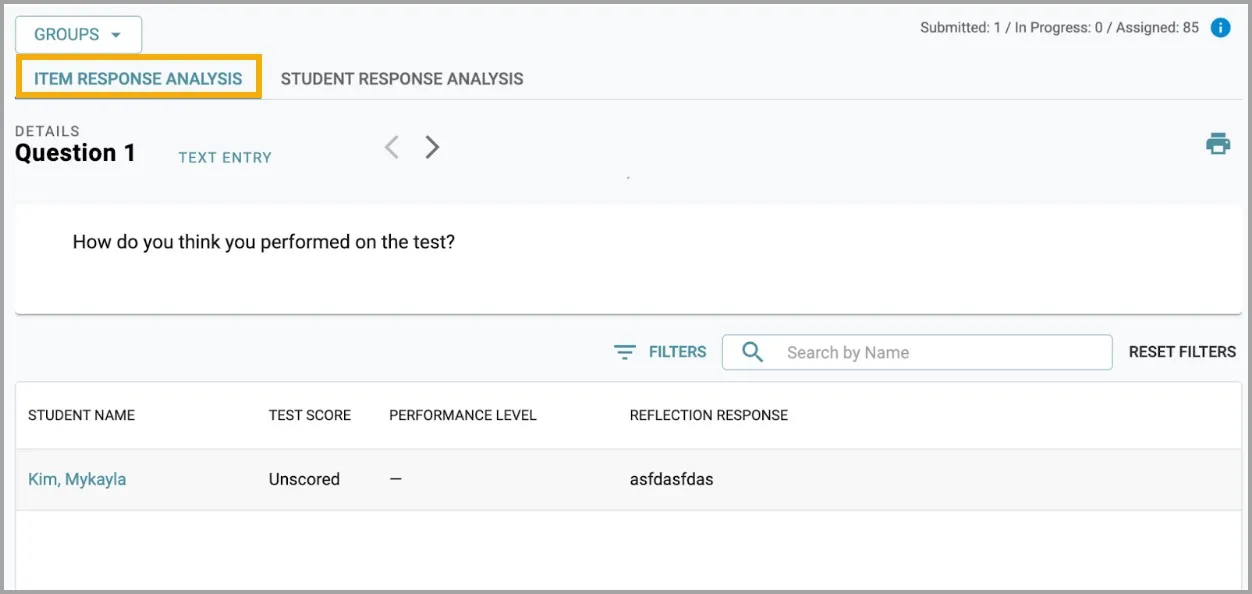
STA allows teachers, administrators, and district leaders to drill into a single test to see how students answered. You can see the item response analysis which looks like this:

The item response analysis shows how well students are performing per question, so teachers can identify weak questions or learning standards that their students are struggling with.
You can also view the performance summary tab which distributes students according to their raw score and performance level. Teachers can see all of their students’ scores, or they can filter it down by class period. Administrators and teachers can filter that information even further by looking at the demographic distribution. This distribution can help administrators perform program analysis and identify at-risk groups of students who need closer monitoring.

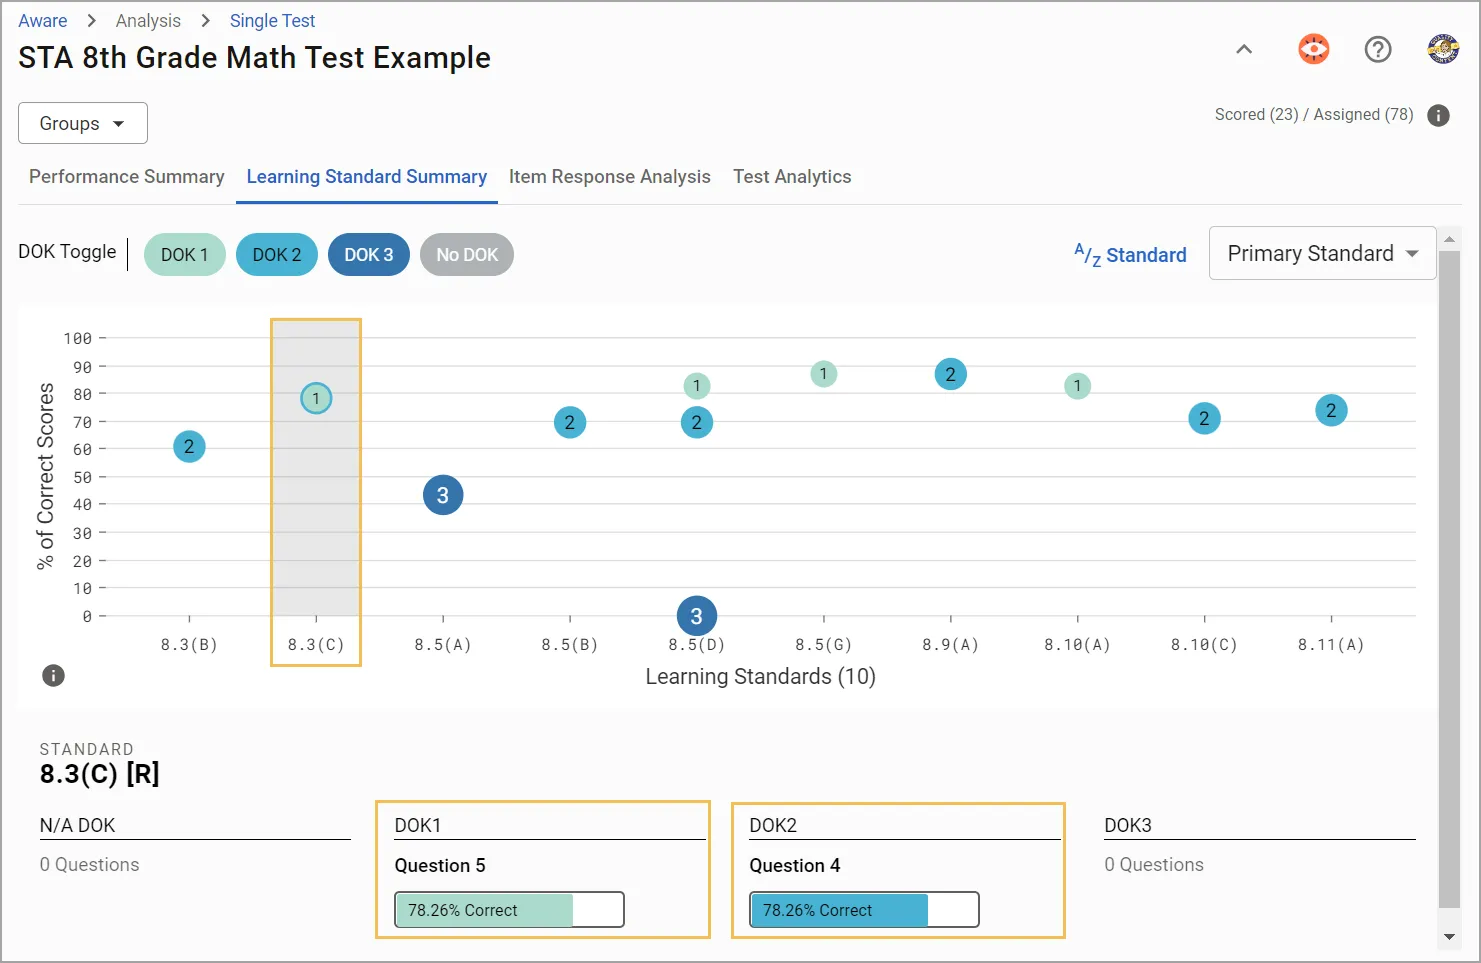
The learning standard summary tab does what you might expect. It shows how students performed per learning standard. Teachers can also see what depth of knowledge was tested on the exam and how well students tested per each depth of knowledge. This way, teachers can not only identify areas where students may need reteaching, but they can also see if students need to be stretched through enrichment.
Next, take a look at Multi-Test Analysis (MTA)
As mentioned above, Multi-Test Analysis is a tool for grouping and analyzing assessment data over a period of time. It is most often used to compare local and district-level assessment performance to state assessment performance using the correlation view.
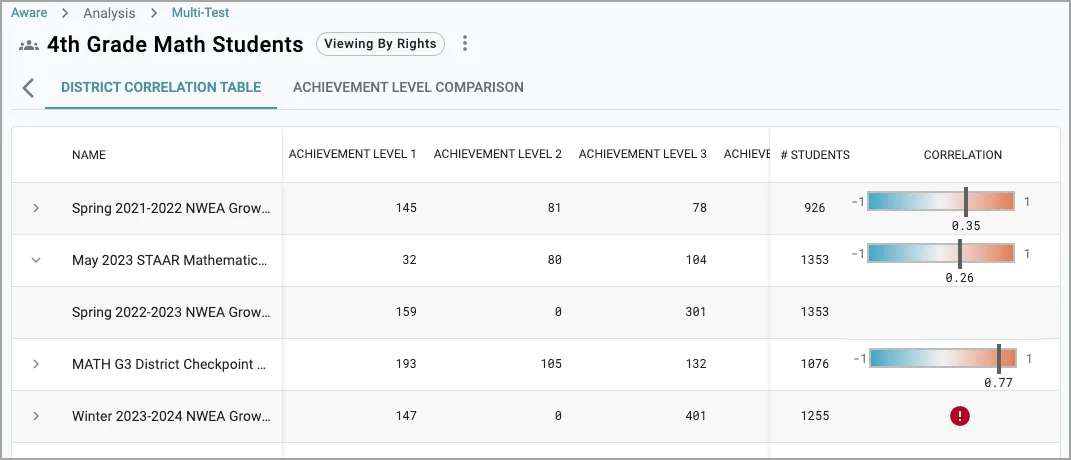
With this information, administrators can determine if their assessments are too easy or too difficult or don’t test the appropriate domains to prepare students for their state assessments.
MTA is a great tool for assessment program analysis and for determining trends, norms, and outliers.
As many states are moving to through-year testing and de-emphasizing the results of state assessments, educators should be able to measure progress over time without the “standard” of the state assessment being the guiding factor.
Using MTA, administrators can group up to 20 assessments for comparison.
Let’s say you want to see how well the same group of fourth-grade math students has progressed using district assessments. You can create a progress profile to compare and analyze these results.
Here’s the beauty of that data visualization.

MTA is special because it does a bit of math that many of your typical administrators either don’t have time to do or don’t know how to do.
Many of our most common assessments are scored differently. We use RIT scores, Raw scores, and Performance Levels to define success on each exam. Well, with all of these different scores, how do we accurately compare them? After all, a 65% means nothing next to the standard formatting of a RIT score.
MTA converts these scores to a common metric, so they can be accurately compared. Then, it creates that beautiful data visualization, so you can easily compare and analyze progress without having to dig through mountains of paperwork.
Here are a few things MTA can help administrators determine:
- If local assessments are too easy or too difficult
- If local assessments are reliably measuring the content
- If students, historically, have been adequately prepared for the state assessment
- Where their teachers may need additional support in order to prepare students
- Which students need additional support to perform well
- School and program-wide deficits that may not be preparing students (especially at-risk students)
Finally, meet our student growth and teacher performance scatterplot
Data visualization isn’t limited to Aware. We also have the student growth and teacher performance scatterplot in Strive, our staff evaluation and professional learning tool.
The scatterplot is a great way for administrators to conduct program analysis without having to wrangle different programs, passwords, and people for information.
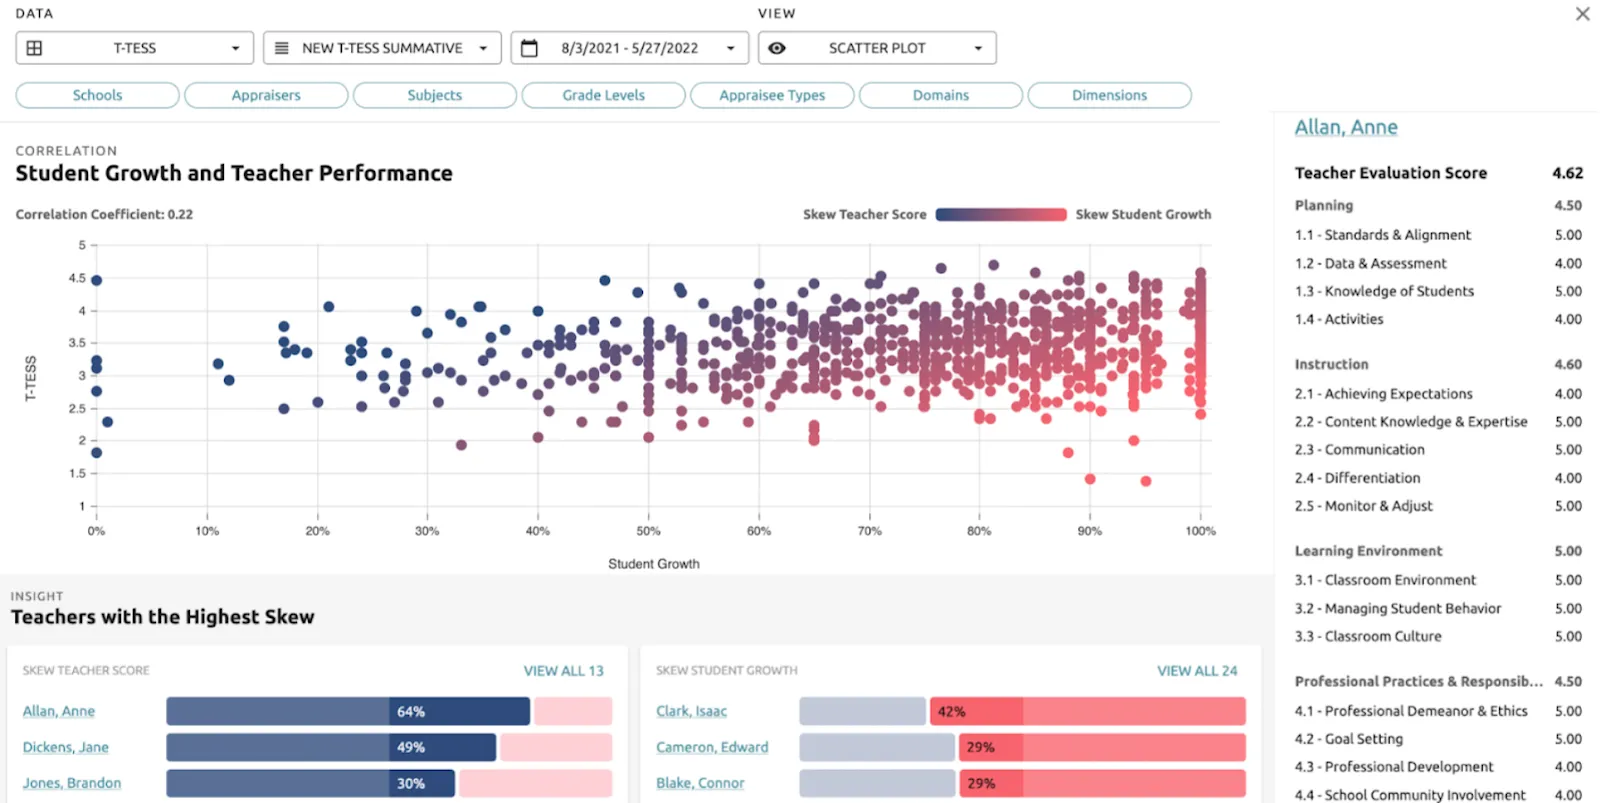
As you can see, the scatterplot not only places teachers on the chart according to their teacher evaluation scores and student growth scores but also automatically sets aside teachers whose data is skewed.
Here’s how to interpret the plot:

So, administrators can not only get an at-a-glance understanding of skew in their evaluation system but can also examine each of the teachers on the scatterplot more closely to begin a deeper investigation into the skewed data.
Here are some of the conclusions an administrator can come to with the help of the scatterplot:
- Assessors need additional training on accurately evaluating a teacher’s skills
- Aspects of the evaluation system that need to be strengthened through improved training initiatives, evaluation forms, and procedures
- Which teachers need additional training on growing students
- Which teachers need to be praised for their progress in student growth
- Areas of teacher growth that can be improved and reinforced through professional learning and evaluation criteria
While this information can be gathered through painstaking data collection and spreadsheet practices, the scatterplot makes it fast and easy.
Assessment creation is faster, easier, and more reliable
We’ve heard it time and time again: teachers don’t have the time or resources to create robust assessments.
Unfortunately, a school system cannot live by district assessments alone. Teachers need to be able to accurately and reliably assess students so they can provide timely interventions and enrichment activities that push students to the next level of growth.
They need to be able to iterate on and improve the curricula so that future generations of students can benefit from the data the assessments provide.
Thankfully, Aware makes it fast, easy, and simple to create robust assessments as a teacher, administrator, or district leader.
Item banks give teachers time and give tests consistency
We partner with item bank providers to free up teachers' schedules when it comes to test creation. These item banks are developed by assessment and curriculum experts familiar with your state's learning standards, so you don’t have to worry about the quality of the assessment items.
When teachers want to create an assessment using items from the bank, they can simply author an assessment and add items that assess the subject, learning standard, and depth of knowledge they’re hoping to measure.
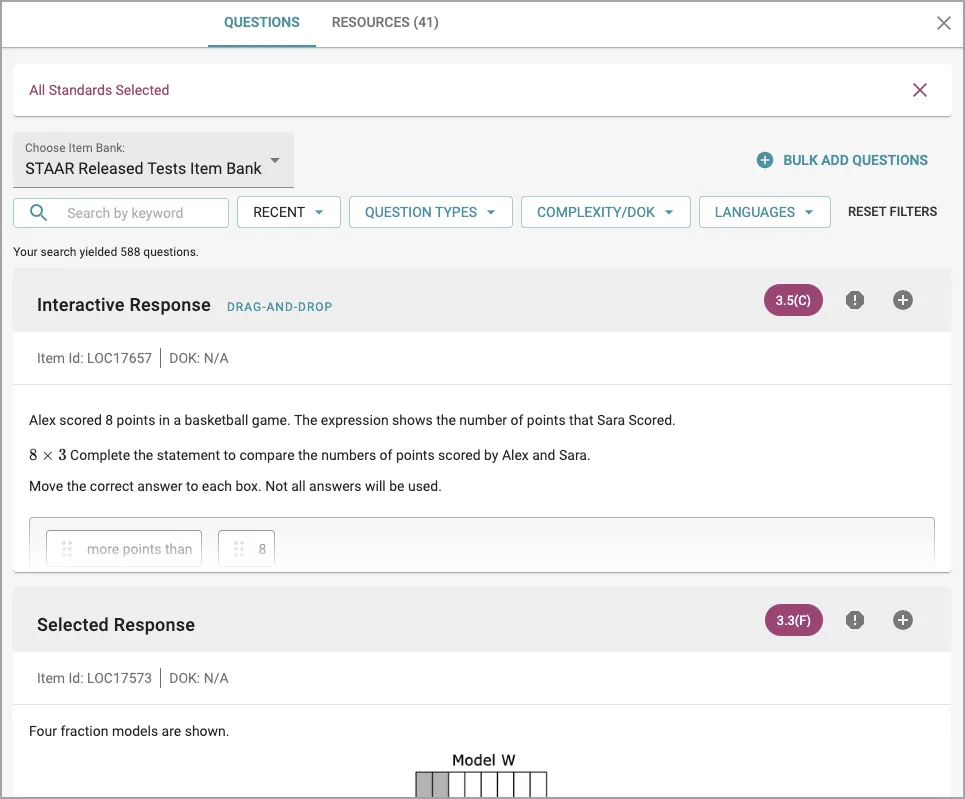
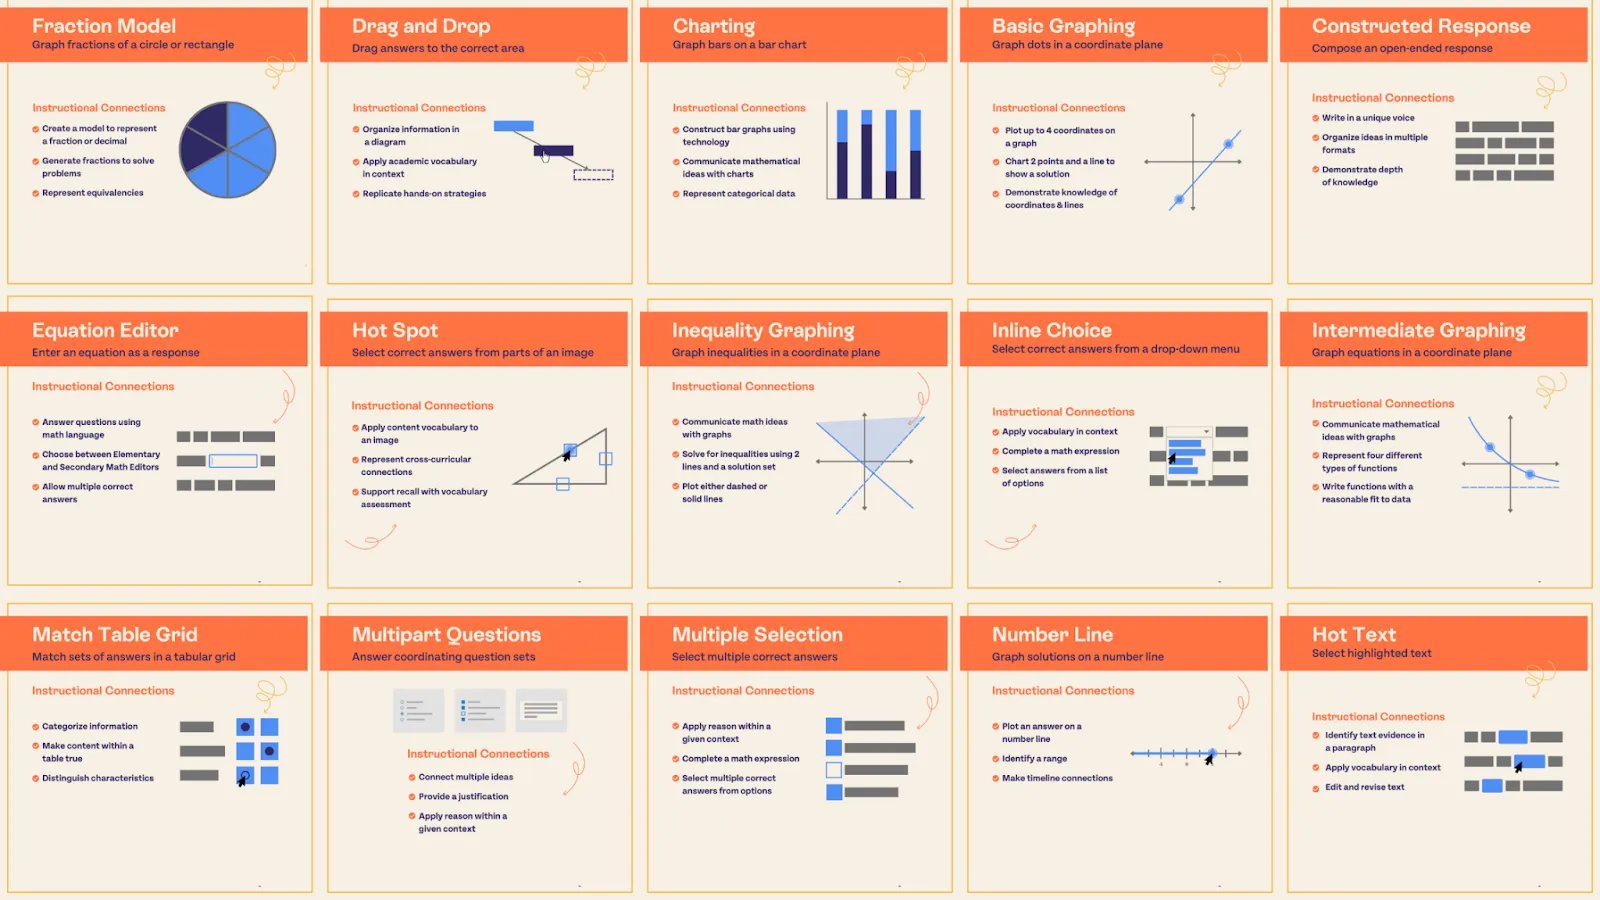
Plus, each assessment item is created using one of our 15 interactive item types.
Interactive Item Types make assessments functional and accessible
The item types were created to emulate the kinds of assessment items students see on state exams. Of course, it’s icing on the cake that these assessment items allow students to demonstrate their knowledge in a variety of ways.
Item types allow teachers to assess student learning in nuanced ways. Based on how students answer and interact with the assessment item, teachers can gather insights about specific learning gaps. Item types also make it easier for students to engage with the assessment and access learning supports.
It’s easier to give and monitor accommodations
Our supports work with every item type in Aware, so students can access content clarifiers, dictionaries, and more at every stage of their assessment.
Plus, it’s easy to switch supports on and off and monitor their usage!
If you’re curious about whether a certain support would improve a student’s performance, simply toggle it on. Use that data to advocate for their continued support around the school.
As far as accountability goes, administrators can run reports to see whether students are using or are able to access their assigned supports.
We know that some students will need additional support and accessibility even though they don’t have a learning plan in place. That’s why the software is built to improve accessibility for all students. We offer tools that help all students process information, such as a highlighting tool, a zoom-in option, and color/contrast options.
While they may seem small, these are all essential components of a healthy assessment system. How students and teachers interact with assessments will inevitably impact performance, data collection, and system improvement.
Take the guesswork out of retests
The majority of teachers aren’t assessment specialists. And any assessment specialist would tell you that it’s a complex process to create retests that accurately measure growth.
For one thing, the assessment has to be similar in difficulty, or it won’t be an accurate measure of progress from the original assessment.
That means that the questions should assess the same depth of knowledge as the previous exam, and the items on the new assessment should cover the same material.
Not to mention that the assessment needs to be given in as similar a fashion as possible, so students aren’t thrown off by new item types, new technology, or a new environment.
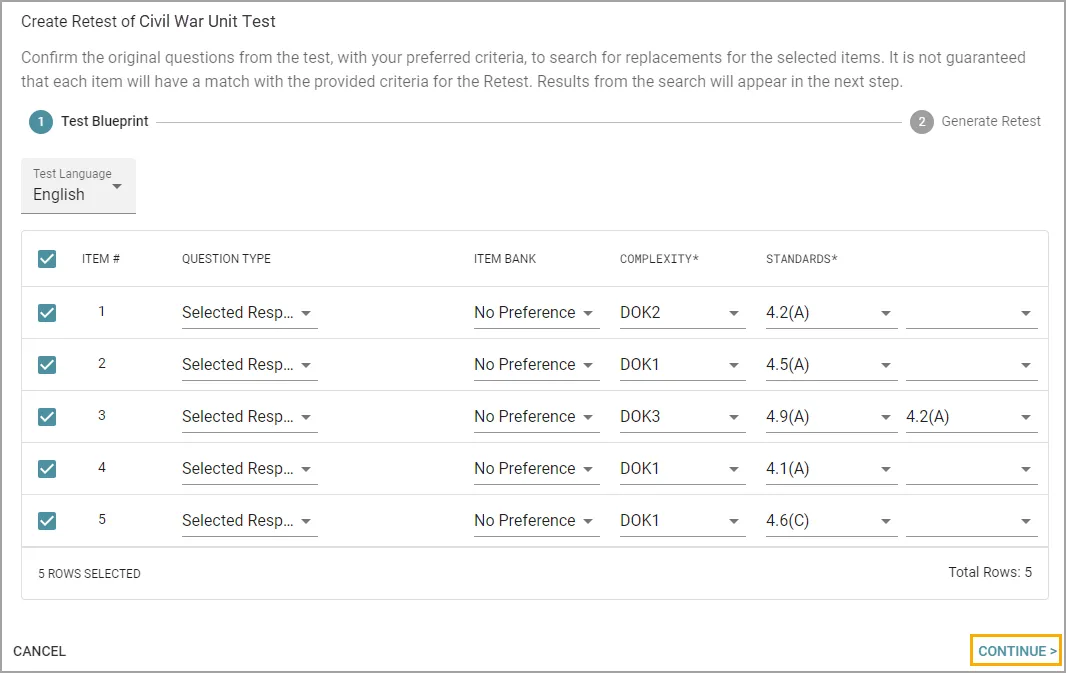
Our tool, Retest, allows teachers to quickly assemble a retest (using items from the item bank) that is as close as possible to the original assessment.
Once they’ve created the retest, they can vet each item and add replacements if there’s a gap in the exam.
Monitor groups and metacognition tools help target nuanced learning needs
All administrator roles are student-focused whether your primary duty is to supervise other adults or not.
If your goal is to grow students, a few Eduphoria staples make it easy for teachers and administrators to grow students, gather data, and spur program initiatives that support students who need additional interventions.
Create monitor groups using Quick Views or Mastery Tracker
Identifying and supporting student groups is valuable not just for accountability purposes. It’s vital that all students receive the support they need, even if they’re running ahead of their peers and require more advanced instruction.
Monitor groups are our solution to a number of pain points. By creating monitor groups in Aware and Strive, teachers can:
- Individualize curriculum and reteaching initiatives for small groups of students with like needs
- Continue to engage students who are ahead
- Stay ahead of progress monitoring initiatives by organizing data for easy analysis
- Assess their own teaching practices and bring concerns to their PLC time for improvement
- Pinpoint clarity and quality issues in assessments by isolating assessment items that may be confusing for certain groups of students
- Provide data to administrators who are interested in the progress of certain student groups
We have a number of ways to group and monitor students.
Quick Views
With Quick Views, teachers can fine-tune their data search settings and “favorite” them, thereby creating a Quick View.

This view is easily accessible and updated with live data, so teachers can easily navigate to the most updated information on the students they’re monitoring.
Saved Quick Views can be accessed via the bookmark feature, so they’re right at your fingertips when you’re ready to analyze some data.
One of our newest features allows teachers to work together with administrators and support staff to monitor students for individual signs of growth.
Mastery Tracker
Mastery Tracker allows teachers to group students who need special support into a tracker. It’s a color-coded tool enabling teachers to use observations to justify their ratings of a student’s level of mastery.
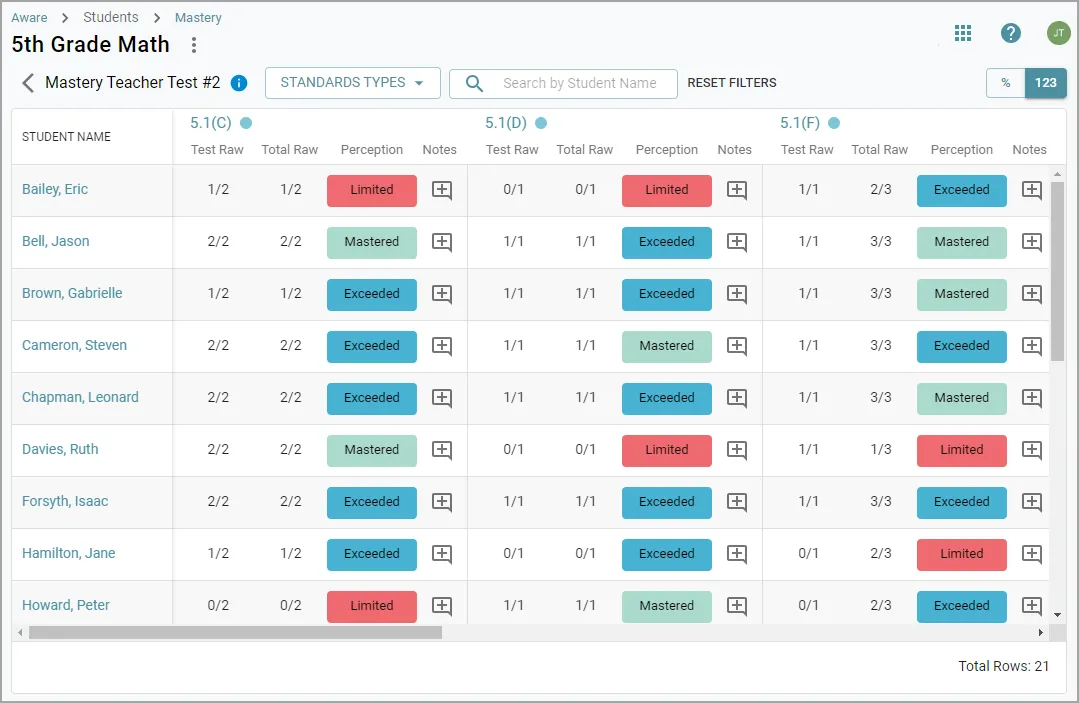
Some students don’t test well. Some students are better verbal communicators than written communicators. That doesn’t mean they don’t understand the material.
With Mastery Tracker, teachers can reward students for their unique displays of Mastery.
They can also monitor the progress of the entire group to see if group reteaching is working.

As you can see, teachers can not only use their own observations to monitor progress, but they can see how students are advancing based on assessment performance. By analyzing assessment performance side-by-side, they can make fast and accurate decisions about the assessments themselves and the needs of the students.
An amazing bonus of Mastery Trackers is that trackers stay with students for their duration at that school. All of the insight that a teacher gleans from their one-on-one and group work with a student can help their next teacher provide more individualized instruction without all of the trial and error of a new school year.
Student portfolios
We monitor students for a lot of reasons. A significant reason we monitor is to assess our own methods to make sure that what we’re doing is actually effective.
In Strive, teachers can create student portfolios where they group students and monitor their progress for evaluations.
They can create goals that coincide with their monitor groups and then measure their success in achieving those goals at the end of a school year.
If their monitor group has specific learning needs, their evaluator can even suggest and provide mentoring and professional learning to help them support that group of students according to those needs.
The data in these portfolios can be exported by evaluators and administrators who are conducting program analysis to see how well teachers are growing students. This is a great starting point for generating ideas about professional learning opportunities and program improvement initiatives.
Gather nuanced learner-centered data with metacognition tools
One of your strongest sources of data as an administrator will always be your students. They’re honest, they’re blunt, and they’re the ones who have the most detailed insight about the inner workings of the school.
We offer metacognition tools that allow teachers to improve their own programs and better serve the students; however, this data can also be useful to administrators as they help their departments to grow and improve.
Reflection
When students are allowed to reflect on their assessments, they become more motivated, engaged, and empowered learners who can work with their teachers to achieve goals.
They also provide valuable feedback on the wording of a test question, the difficulty of an assessment item, and misconceptions from the curriculum that held them back.
Student confidence
We want to make it easy for students to give us data. They’ve got a million other tasks on their hands, so feedback mechanisms should be seamless and helpful for their own processes.
The student confidence tool is optional, easy to use, and provides abundant data on how students are feeling about the assessment and the curriculum.
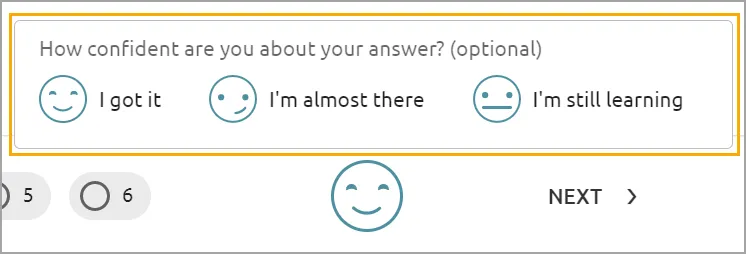
The data provided by this tool can help teachers provide truly individualized support and instruction.
Paired with assessment data, a student’s confidence scores can provide interesting insight into their state of mind and the assessment itself.

Let’s say the majority of students select high confidence on a question that they answered incorrectly. The teacher can use this information to figure out where the misconception originated and correct the assessment or the curriculum.
Trends in student confidence are extremely helpful for program administrators.
Do students need emotional support during the testing season?
Do they need additional tutoring on how to take a test, especially if they’re using unfamiliar software?
Are students feeling largely unprepared for district-level assessments, and what kinds of programs can you initiate to solve that?
Reports are customizable based on your role and data needs
As you can see, we offer a lot of data. We’re big fans of live data that update with each new assessment, evaluation, or form.
However, reports are extremely useful for examining historical data and bringing information to the relevant parties for discussion and decision-making.
Because reports are locked behind certain roles in the organization, data is safe and secure. Only those with permission to see student and employee information can access it.
Strive reports are a robust source of information for program analysis.
Administrators can run reports on all kinds of information, including:
- The skill level of their teachers and staff
- The professional learning their staff is already taking
- The goals their staff are creating and measuring
- The status of required steps in the evaluation process
- Evaluation ratings for staff members
- Performance ratings per dimension
- Interrater reliability between appraisers
- How professional development affected staff performance
While Aware shines in data visualization, it also offers a range of reports that are useful for administrators in various roles.
Spread your data philosophy with conferences
While you’re feeling out the gaps in your school or district’s processes, you’ll need to help your staff learn and practice new procedures so programs can strengthen and improve.
With Strive, you can host conferences that are timely, relevant, and specific to the needs in your learning community.
For example, let’s say that while you were gathering data from department heads, you discover inconsistencies in the ways teachers are gathering and using data to inform instruction, and it’s resulting in assessment variability.
This is a great opportunity to develop your data philosophy and host a conference teaching your staff the practices you’d like them to implement.
Because this is a need that you’ve identified as fairly universal, you can also track that teachers are attending by rewarding or denying credit. As teachers can sign into your conference via custom QR codes, it’s easy and simple to track completion.
If you’ve covered specific strategies or important skills and you want to measure the success of your professional development, add criteria to your evaluation document that will help appraisers accurately measure the teacher’s implementation. Plus, evaluation criteria will give your teachers something specific and actionable to learn and build upon.
They can even create goals and search for additional learning opportunities within Strive to help them develop that skill.
Our software works better together
I’m sure you’re aware by now that every person in your organization is indispensable. You all play a part in supporting students, and each person’s role is dependent on the other to make its greatest impact.
We understand that software should support each person’s roles and responsibilities while also contributing to the larger process of student growth.
You work better together, and so does our software.
With Strive, Aware, and Beacon, educators don’t have to battle between unlike software offerings, unique passwords, and incomprehensible permission settings that make data inaccessible to those who need it.
We thought about what you need to work better together, refining our features and our interface over the last twenty years to solve real problems for real educators.
Of course, our software works better together because it mimics the ways educators work together.
If you’re interested in talking with our team about your specific needs, we're ready to help.
Reach out to our team to talk about your data needs
If you’re interested in our solutions, would like to save time and effort, or are simply interested in the comprehensive support that we provide to our customers, get in contact with us using the demo button on our website! We know we’ve created a solution that solves problems for educators around the country, but your experience is unique to your school and district. We want to hear about what you need and how we can help.
Administrator Bulletin Board
At Eduphoria, we don’t just work with educators. Many of our employees are current and former educators, including former school and district administrators. We know as well as anyone how difficult it is to step into your position, so we’ve set up a bulletin board of advice and encouragement for you. Here’s the advice some of our former administrators have to offer.


.png)