


.png)
I want to talk about the hot topic of Student Growth, but I’m going to take the long way around. So let's begin with a little pop quiz:
Which of these statements is more meaningful?
- Kamala earned a scale score of 1621 on Grade 4 STAAR Math this year.
- Kamala scored within the Meets Grade Level performance level on Grade 4 STAAR Math this year.
How about these statements?
- Julio earned Approaches Grade Level on Grade 3 STAAR Math last year, and the difference between his Grade 4 STAAR Math and Grade 3 STAAR Math scale scores is 105.
- Julio’s Progress from Grade 3 to Grade 4 on STAAR Math was Expected.
As educators, we can’t do much with a 1621 or a 105. We need the words and descriptors that go with these numbers to help us figure out what each of our students might need from us.
Common descriptors for student growth
Often in local assessments, we assign percent scores to student results based on the number of items they get correct. Then we attempt to associate meaning to these results. Since 70% of the questions were correct, Maria gets a passing grade in the grade book (and can take part in extracurricular activities). But this is a summative use of a score. If we are trying to inform potential intervention or enrichment needs, what does this 70% mean? If the assessment were a vocabulary quiz, can we consider 70% to be “passing”? What if it were an end-of-unit exam? How many items on the assessment were DOK 1, DOK 2, or DOK 3?
So now we are on a slippery slope. We hear someone ask the question, “What percent scores on STAAR equal the different performance levels?” We do a few conversions and end up with some cut scores and try to call them “approaches, meets, and masters” for our local tests. We have ended up in a space where we are treating our local fractions unit tests as though they are scaled with the state’s Assessment of Academic Readiness scale scores. We might even find ourselves subtracting some percent scores to try and identify something that might look like “growth” methodologies.
A Celsius temperature reading cannot be subtracted from a Fahrenheit one because they are not using the same scale. To compare them, you have two options. If you need to know the actual temperature difference, you need to convert them to the same scale. If you just want to know if you need to bring a sweater or a jacket, labels like cold, cool, warm, and hot will suffice. It was cold this morning, it is warm right now, but it will cool down some at sunset, so I still need at least a sweater for later. I am using measurements to draw conclusions and then make an action plan. It is the action plan that ultimately matters to me.
The same is true with measurements of student learning. We as educators assess student knowledge and skills through a variety of formal and informal methods. We do this to draw conclusions about learning to make action plans for first-time instruction, intervention, and enrichment. It is those plans that matter for our pedagogical practices.
Our challenge: how can we make our varied assessment data have meaning for drawing conclusions? 70% on a vocabulary quiz does not exist on the same scale as 70% on an end-of-unit exam or 70% on STAAR. So why would we treat these numbers as though they do? Instead, why not treat student performance on our local assessments as something that needs performance levels with descriptors? Maybe something like a vocabulary quiz, with its focus on DOK 1 items, has two performance levels: Satisfactory and Needs Review. A unit exam might need more nuance and could have three levels like STAAR: Approaches Unit, Meets Unit, and Masters Unit. A student who consistently earns “Satisfactory” on quizzes and “Meets Unit” on bigger exams might benefit from practice in DOK 3-level assessment tasks. One who often earns “Approaches Unit” might have deficits in the application of their knowledge.
How to give meaning to the data you gather
The easiest method to determine growth is to take a measurement, take a second measurement at a later time, and subtract the results. The difference will equal a growth number and, if high enough, it will equal progress.
STAAR has to do this; it’s the only way to be consistent and equitable on a state-level, criterion-referenced assessment. But STAAR results also translate into Progress Levels with descriptors. For example, groups of students can earn Limited Progress from one year to the next. We know, regardless of how they performed, this means it was not to the degree expected from one grade level to the next.
But we measure linear growth in this way because STAAR in one year and STAAR in the next use the same scale. Our local assessments often do not. So instead, we validate our assessments with practical professional knowledge, drawing conclusions from the results.
We then vary our assessments based on these desired conclusions. We assign warm-up activities, tickets out, quizzes, exams, projects, and performance tasks. And… that’s all we need to determine if it’s jacket or sweater weather. We aren’t assigning accountability ratings; we’re trying to figure out who knows what and what kinds of interventions/enrichments will be necessary.
Student growth is a function of student performance over time. If it helps, we can make up a silly but impressive-looking formula to express this:

Now, we have established that student performance does not have to be on the same scale as long as you don’t want a number. In our classrooms, we are not responsible for developing accountability ratings. We don’t need any fancy-pants math to look at some results and draw conclusions about learning. And if we are looking at a battery of performance results from a timeframe, we can figure out what those mean, too. As we know, the conclusions and the action plan from those conclusions are what really matter for us.
So let's update our visual to something more practical:
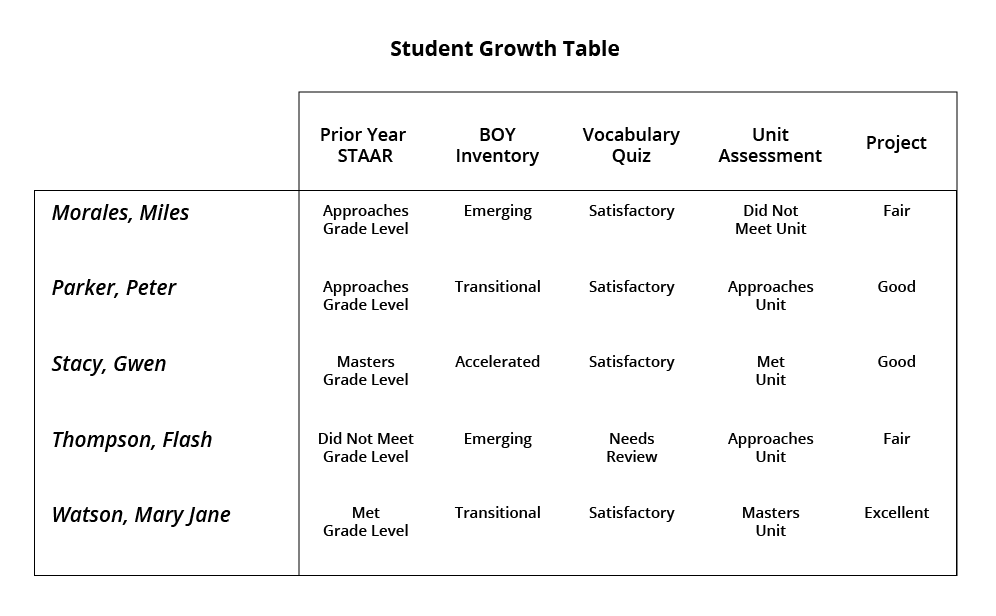
Here we have a set of students and a series of assessments that have meaning to the educator who compiled them. We can assume that the Vocabulary Quiz, Unit Assessment, and Project had summative scores recorded, but note we do not include those here. Instead, we have performance levels translated from various scales: STAAR scale score, inventory scale, two percent scores, and a rubric.
This is why I like SLOs. With an SLO, a teacher, or team of teachers, decides what to focus on and then collects student performance at different times for that focus area. It can include only rubric results (Skill Profiles and Targets), or consist of other evidence of learning as necessary. The focus is on the next steps. With SLOs, data inform not only pedagogy but professional learning, as well. Instructional leaders can coach individual teachers or teams based on specific needs. While one person may struggle with deconstructing data trends, another may need mentoring on how their professional learning deficits might relate to those trends. A team might need help working together developing common strategies for common issues.
The real message behind student growth scores
Data and numbers are part of the program, but they are not THE program. Student growth is about teacher impact. And teacher impact is about what we do as educators once we learn what students have learned - and what they have not.
How do you track student growth and progress in your classroom or on your campus? I bet you’re doing something. I bet you have several current practices, some that you’ve been doing for years. Do you have a spreadsheet? A data wall? A binder? Do you have student-level artifacts students use to create goals for themselves as they progress through the school year?
Teaching will always include progress monitoring. But, with the hot-topic buzz-wordiness of "Student Growth and Progress" dominating discussions right now, the real question is: "How connected and formalized are your current practices for monitoring student performance over time?"



%20(1).png)
%20(1).png)
%202.png)
.png)